
If you run a database cluster, something has told you it's "Healthy." A dashboard, a status call, a green check in a console. If you've been doing this long enough, you've learned not to lean on that word too hard. You remember the failover that was supposed to be routine and wasn't: the standby that turned out to be minutes behind, the "highly available" cluster that lost data the one time it mattered.
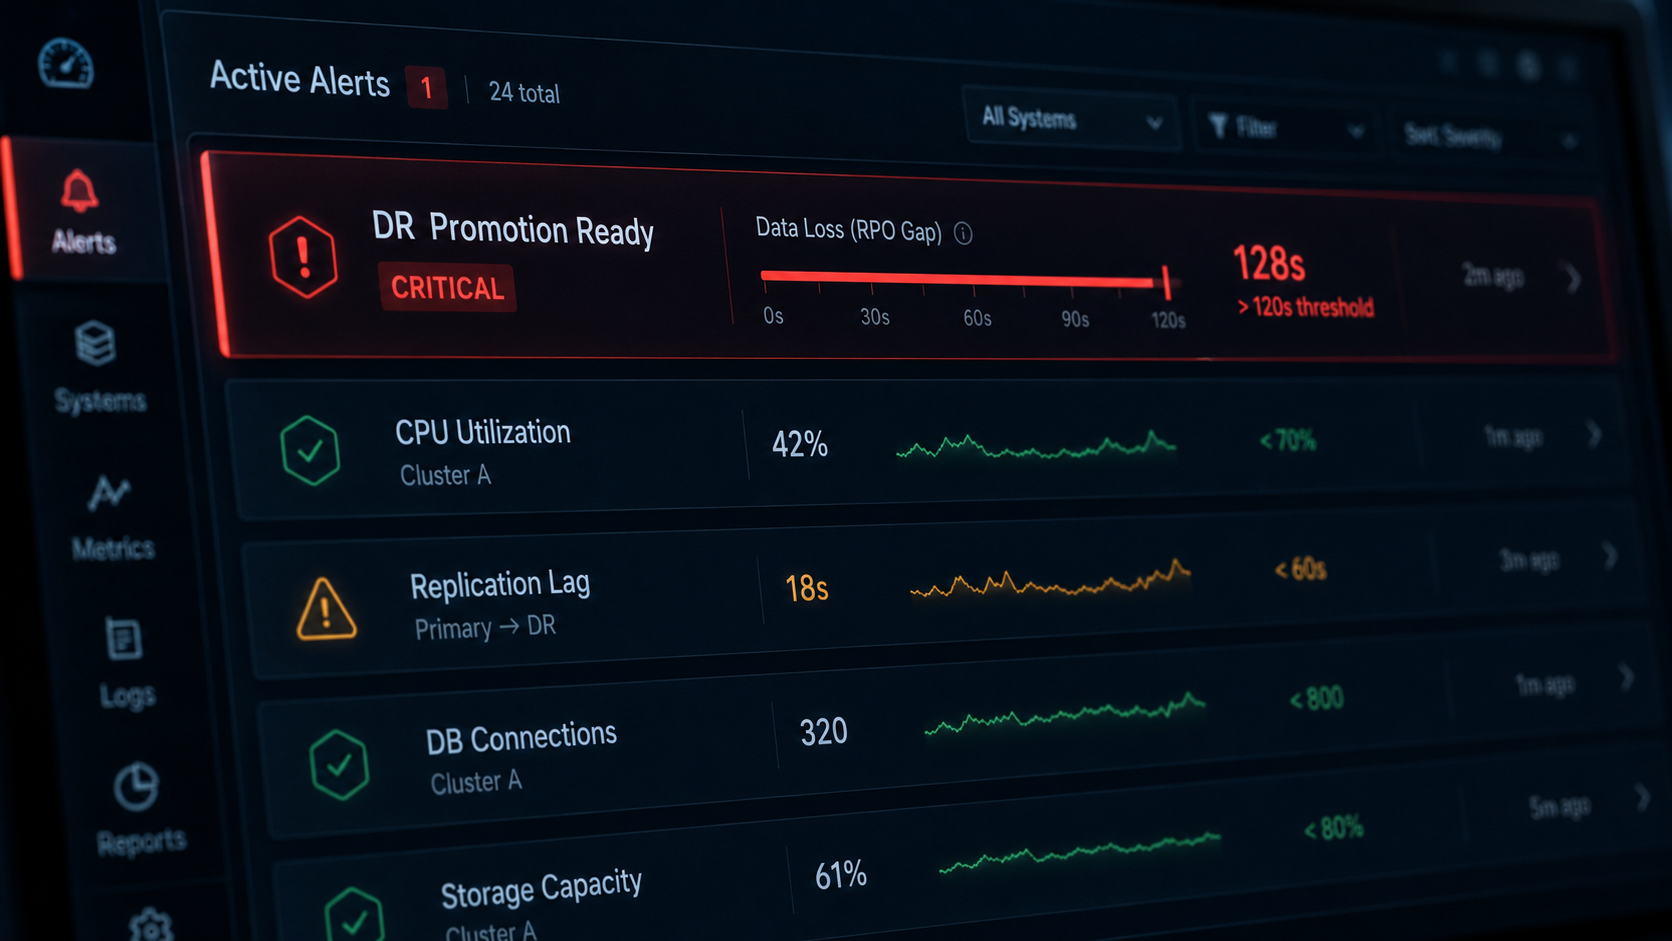
Here's the gap, up front. Your HA tooling is good at one thing: telling you the replicas are in their expected synchronization state (synchronized, OK, Peer). What it usually isn't telling you is the quantity that actually decides a disaster, which is how much data you'd lose (your RPO) and how long recovery would take (your RTO) if the primary failed right now, computed continuously and alarmed before you need it. Each of these databases exposes the raw numbers to work that out. Almost nothing turns them into a standing readiness signal. The Integration Plumbers Plug-ins for Oracle Enterprise Manager enter Early Access on July 31, 2026, and they compute that composite, "DR Promotion Ready," in the EM repository, the same way across all three databases, with a default CRITICAL alert.
This post has three parts: why "synchronized" isn't "safe," the same gap in MySQL, SQL Server, and DB2, and why Enterprise Manager's repository is where you close it.
Why "synchronized" isn't "safe"
A replica that reports its expected synchronization state is telling you a category: a green light that says "operating as configured." It isn't telling you how far behind it is, or what a failover would cost you.
Those are different facts, and the difference is widest where DR actually lives: asynchronous replication, the normal choice for a standby in another data center or region. With async replication, "healthy" and "synchronizing" are the correct, expected states, and they stay true while the standby sits seconds or minutes behind the primary. Green means the link is up and behaving as designed. It doesn't mean you can lose the primary this instant without losing data. The distance between those two is your exposure, and it's the number the default view doesn't put in front of you.
For the engineer on call, that distance is the whole ballgame. It's the difference between a controlled, no-data-loss failover and a Monday-morning incident review.
The same gap, three databases
What's striking is that all three databases hand you the raw material, and all three stop at state rather than exposure by default.

MySQL, InnoDB ClusterSet. ClusterSet.status() (MySQL Shell 8.0 and 8.4) is a cross-cluster view. It will tell you whether the asynchronous channel between your primary and replica clusters is running or broken; a fully stopped channel shows up as globalStatus: OK_NOT_REPLICATING. What a single default call won't give you is the quantity: how far behind a replica cluster is right now. The GTID-level lag detail only appears at higher "extended" verbosity, and even there it's a point-in-time figure. So a channel that's flowing but lagging reads as OK while your data-loss window grows, with nothing trending it and nothing raising an alarm.
SQL Server, Always On availability groups. This is the best-instrumented of the three, and the most revealing. Microsoft publishes the formulas: estimated data loss is roughly log_send_queue divided by the log-generation rate, estimated recovery is roughly redo_queue divided by redo_rate, and the gap in last_commit_time between primary and secondary, in Microsoft's own words, "represents approximately the recovery point objective." SSMS's Always On dashboard even ships the columns, "Estimate Data Loss (seconds)" and "Estimated Recovery Time (seconds)." The catch is in the defaults. Those columns are hidden unless you add them, they're point-in-time rather than trended, and there's no built-in threshold alert; you get one only if you hand-build Policy-Based Management policies. What is on by default is the synchronization-state health policy. And for an async-commit AG, the expected healthy state is "SYNCHRONIZING": healthy by design, while you can still lose data.
DB2, HADR. DB2 hands you the gap most directly of all. HADR_LOG_GAP is the running average of (PRIMARY_LOG_POS − STANDBY_LOG_POS), which is literally how far the standby is behind the primary, and IBM's own guidance is that "HA/DR protection decreases as the gap grows." The raw exposure sits right there in MON_GET_HADR. What the native free console gives you is the current HADR state (role, Peer, Connected), not that gap trended forward into a standing takeover-readiness signal you can put a CRITICAL alert on.
The common thread: every one of these exposes the ingredients of a real RPO/RTO readiness number, and none of them stands one up by default. So you find out your exposure after the failover instead of before.
Why the Oracle Enterprise Manager repository is where you close the gap
The reason this gap persists isn't that the data is missing. It's that turning point-in-time fields into a readiness signal you can trust means computing it, keeping its history, and alarming on it, continuously, for every member. That work has to live somewhere outside the database, and a management repository is built for it.
Oracle Enterprise Manager already collects every member target's metrics into one repository, over time. So the plug-ins can do the three things the native views leave to you:
- Compute the composite: primary healthy, replicas healthy, channel OK, and lag within bound roll up into a single DR Promotion Ready verdict.
- Trend it: is the gap growing over the last hour, even while every node still reads green?
- Alarm on it, with a default CRITICAL threshold wired into the incident and notification flow you already use in EM. No per-instance policies to write, no hidden columns to switch on, and the same signal whether the target is MySQL, SQL Server, or DB2.
The database can tell you its state. Enterprise Manager can tell you, continuously, whether you're ready.
"Synchronized" is a state. DR-readiness is a quantity: how much you'd lose and how long you'd be down. It only helps if you've computed and trended it before you need it. That's what these plug-ins are built to do, in the console you already run, across all three databases at once.
For whoever's on call, that's the point. You find out the standby isn't ready in a Tuesday-afternoon email, not in a Saturday-night incident. The cluster's job is to survive losing a node. Your monitoring's job is to tell you, honestly and in advance, whether it can.
This is the second database blind spot we've mapped in this series. The first was the one you only notice when you're already trying to recover: The Backup You Can't See, on why your estate monitoring rarely tells you whether last night's backup even succeeded. Same three databases, same console, same idea: the evidence is already there; nothing turns it into an alarm.
Get Early Access
DR Promotion Ready is one of the capabilities arriving with our Enterprise Manager plug-ins, and Early Access opens July 31, 2026. Want it watching your clusters first? Learn more and sign up:
- MySQL Plug-in for Oracle Enterprise Manager
- Microsoft SQL Server Plug-in for Oracle Enterprise Manager
- DB2 Plug-in for Oracle Enterprise Manager
Isn't a 'Healthy' or 'Synchronizing' replica already safe to fail over to?+
Not necessarily. Those states report that replication is running as configured, not how far behind the replica is. Under asynchronous replication, "healthy" and "synchronizing" are the correct, expected states even while the standby sits seconds or minutes behind the primary. That distance is your data-loss exposure, and the default view doesn't put a number on it.
What's the difference between RPO and RTO here?+
RPO (Recovery Point Objective) is how much data you'd lose, measured in time: the window of committed transactions the standby hasn't received yet. RTO (Recovery Time Objective) is how long recovery would take, largely the time to replay transactions the standby has received but not yet applied. DR-readiness is about both, computed continuously, rather than a single green synchronization light.
Which databases does DR-readiness monitoring cover?+
MySQL (InnoDB ClusterSet), Microsoft SQL Server (Always On availability groups), and IBM Db2 (HADR), through their respective Integration Plumbers Plug-ins for Oracle Enterprise Manager. The point is the estate-wide view: the same "DR Promotion Ready" signal across all three engines in one console, rather than a different console and a different definition per engine.
Doesn't SQL Server already show estimated data loss and recovery time?+
It exposes the raw fields, and SSMS's Always On dashboard even ships "Estimate Data Loss (seconds)" and "Estimated Recovery Time (seconds)" columns. But those columns are hidden unless you add them, they're point-in-time rather than trended, and there's no built-in threshold alert unless you hand-build Policy-Based Management policies. What's on by default is the synchronization-state health policy, which for an async-commit AG reads "SYNCHRONIZING" as healthy.
What is 'DR Promotion Ready' actually computing?+
It rolls four conditions into one verdict: the primary is healthy, the replicas are healthy, the replication channel is OK, and lag is within a defined bound. That composite is computed in the EM repository, trended over time, and alarmed with a default CRITICAL threshold, so a growing data-loss window pages someone while there's still time to fix the channel or plan the failover, instead of turning up mid-incident.
Do I have to write policies or scripts to get the alert?+
No. The plug-ins ship the DR Promotion Ready metric with a default CRITICAL threshold wired into the same incident and notification flow you already use in Enterprise Manager. There are no per-instance policies to author, no hidden dashboard columns to switch on, and the signal is defined the same way whether the target is MySQL, SQL Server, or DB2.