Software
MySQL Plug-in for
Oracle Enterprise Manager
Monitor MySQL servers, InnoDB Clusters, and InnoDB ClusterSets in Oracle Enterprise Manager, with the same incident rules, notifications, and compliance results you use for Oracle Database.
28
Console Pages
1,000+
Performance Metrics
65
Compliance Rules
8.4 & 9.7
MySQL LTS Certified
Headline Features
Statement analysis, wait profiling, disaster-recovery readiness, index findings, and backup visibility, each on its own page in the Oracle EM console.
Query Analyzer with On-Demand EXPLAIN
The top 25 statement digests, ranked by latency, execution count, or first seen and refreshed every 60 seconds, with the plug-in's own monitoring statements hidden by default. Select a statement, fill in its placeholders, and click Explain: the plan comes back from an Oracle EM job and renders on the same page. Explaining a statement does not execute it.
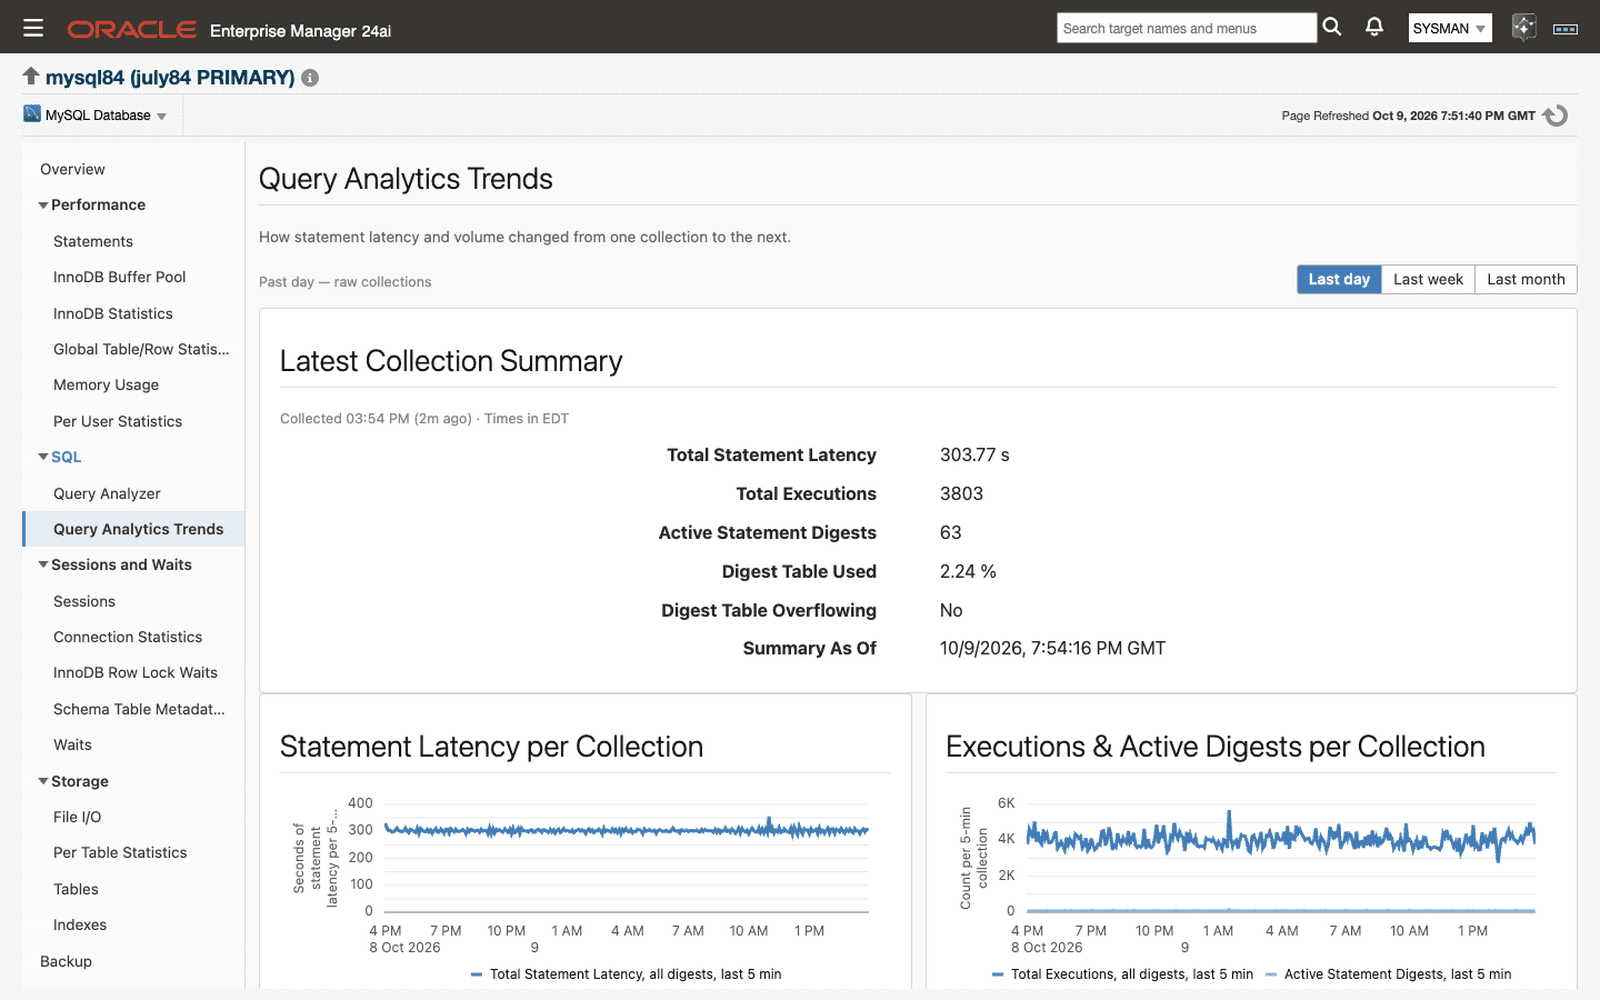
Query Analytics Trends
Statement latency and execution volume collection by collection, and the heaviest statements over the last day, week, or month, ranked by latency, executions, or no-index executions. The page also shows how full the digest table is and whether it is overflowing. History keeps each statement's digest and figures, not its text. The last day is exact; week and month are scaled from Oracle EM's hourly and daily rollups.
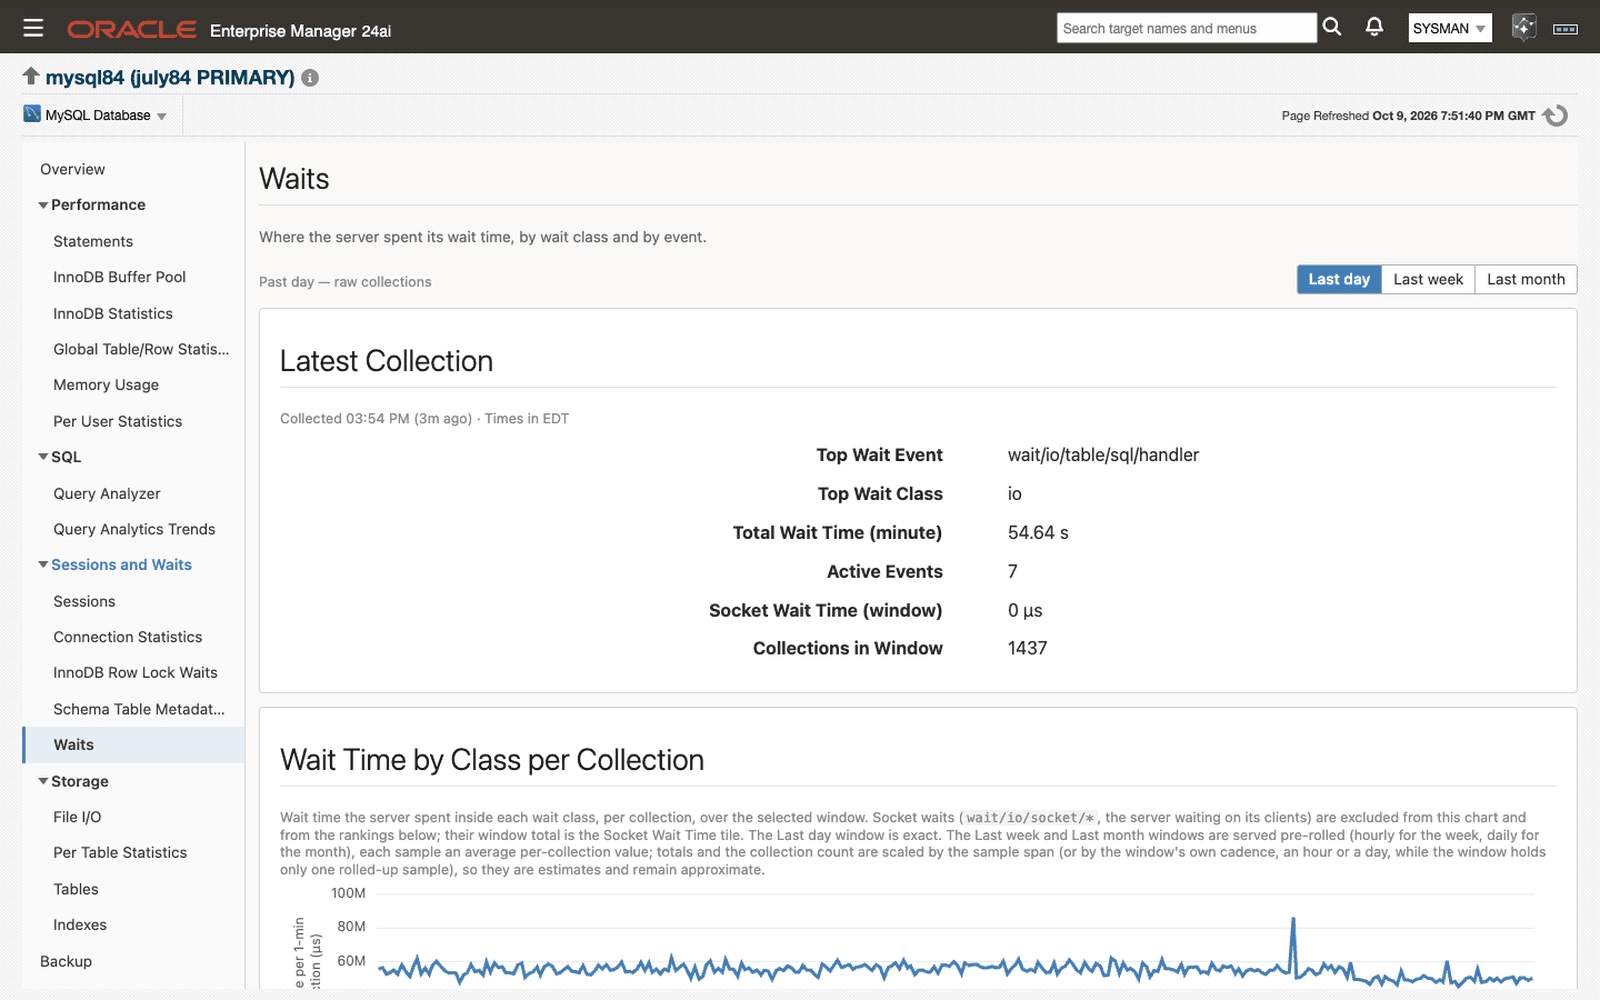
Waits
Where the server spent its wait time over the last day, week, or month, by wait class and by wait event, with socket waits totaled separately. Two thresholds ship: a wait event averaging more than one second per wait for three collections, and lock as the leading wait class for five. The lock class covers table and metadata locks; row-lock contention has its own InnoDB Row Lock Waits page.
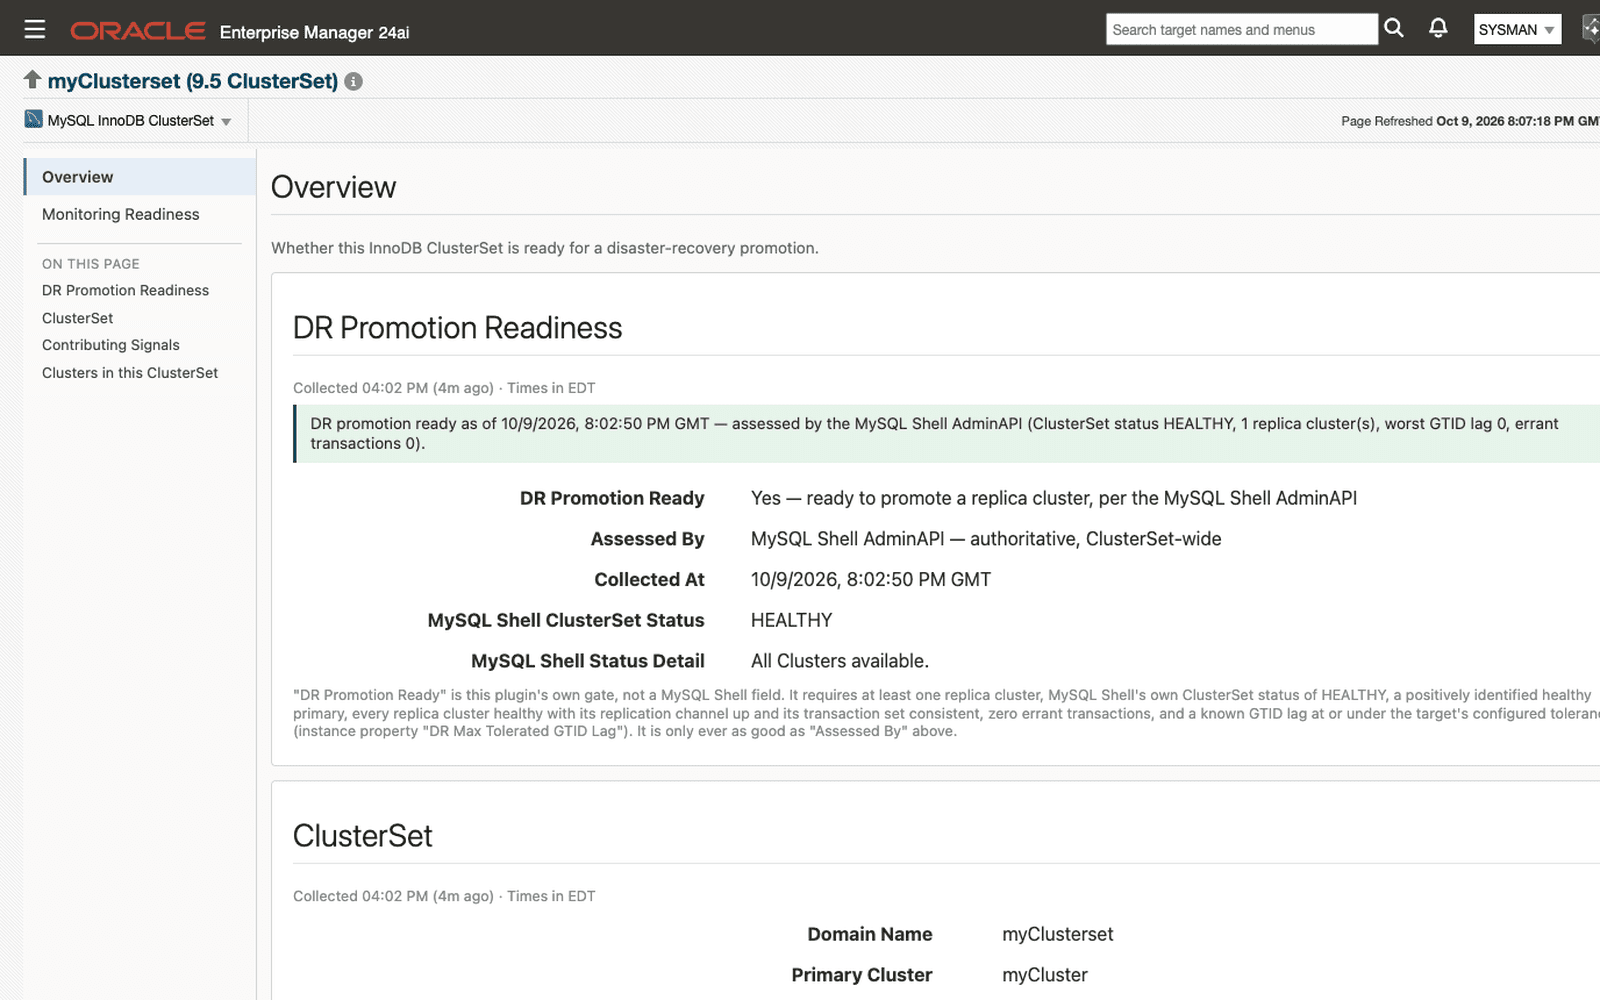
InnoDB ClusterSet DR Promotion Readiness
Answers whether the ClusterSet can be failed over right now, and shows every signal behind the answer. The verdict requires at least one replica cluster, a HEALTHY ClusterSet with a healthy primary, every replica cluster healthy with its channel up and its transaction set consistent, no errant transactions, and GTID lag within the tolerance you set on the target. Readiness is gated on replication heartbeat freshness, so a network partition reads as not ready even when MySQL Shell reports HEALTHY. A critical alert fires after two consecutive failed checks.
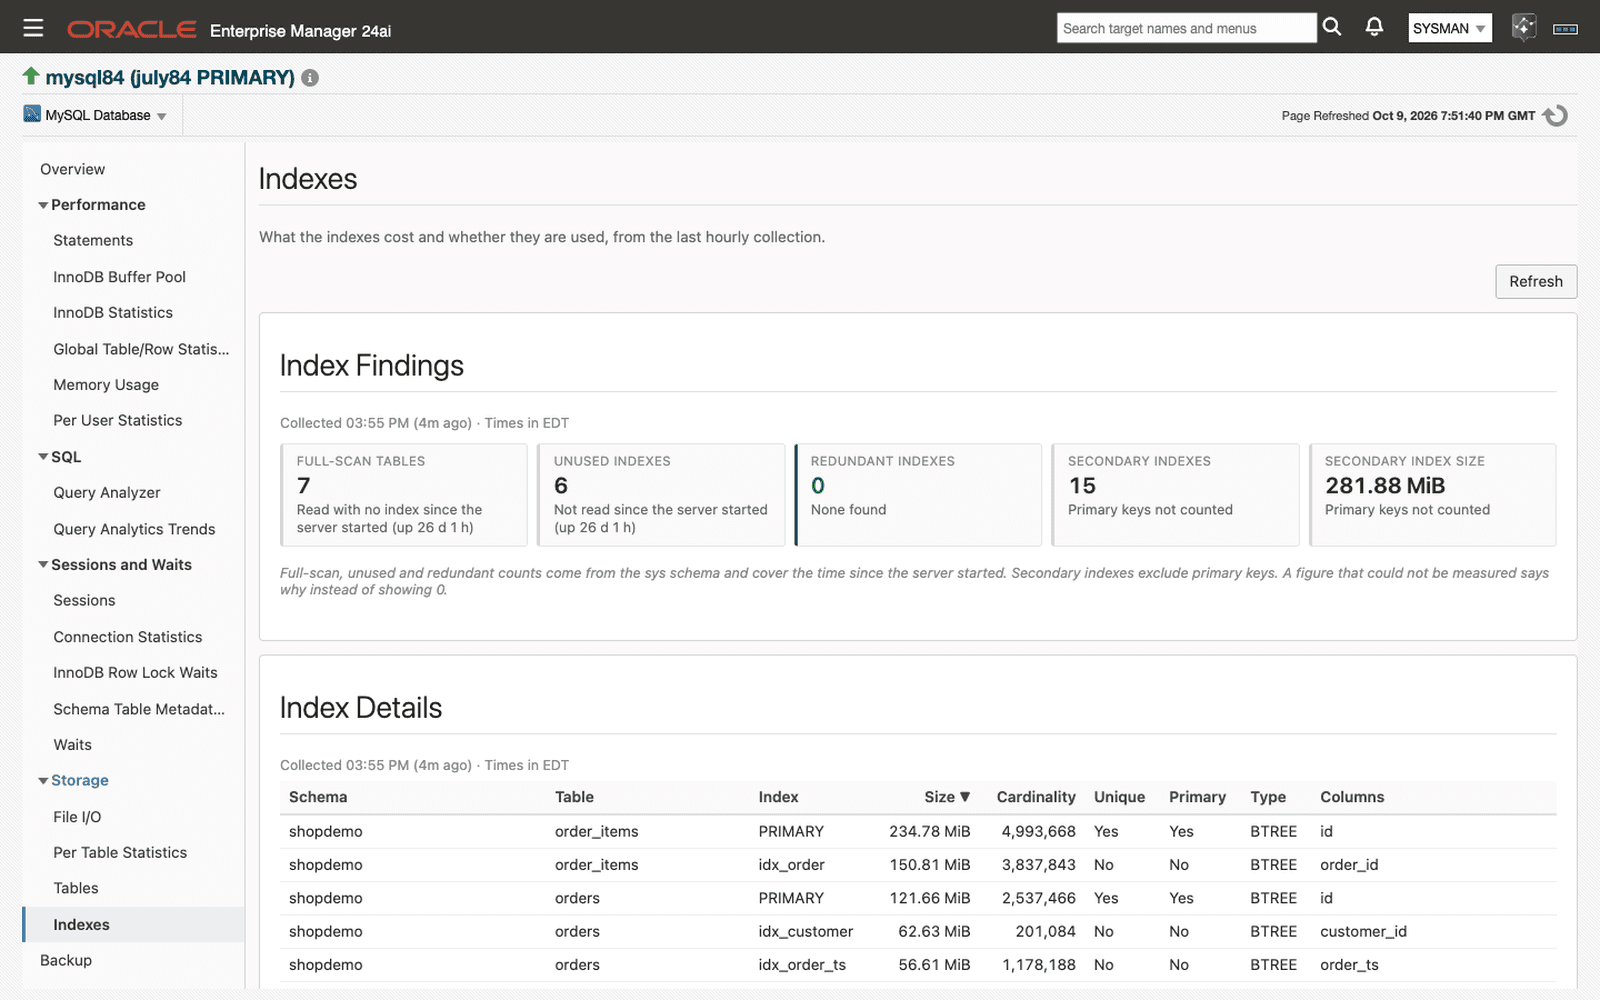
Tables and Indexes
Tables shows how storage divides between tables, with the data, index, and free space of each. Indexes reports full-scan tables, unused indexes, and redundant indexes, plus secondary index count and size, alongside the size and cardinality of the largest indexes. Both pages read the last hourly collection, and a figure that cannot be measured says why instead of showing 0.
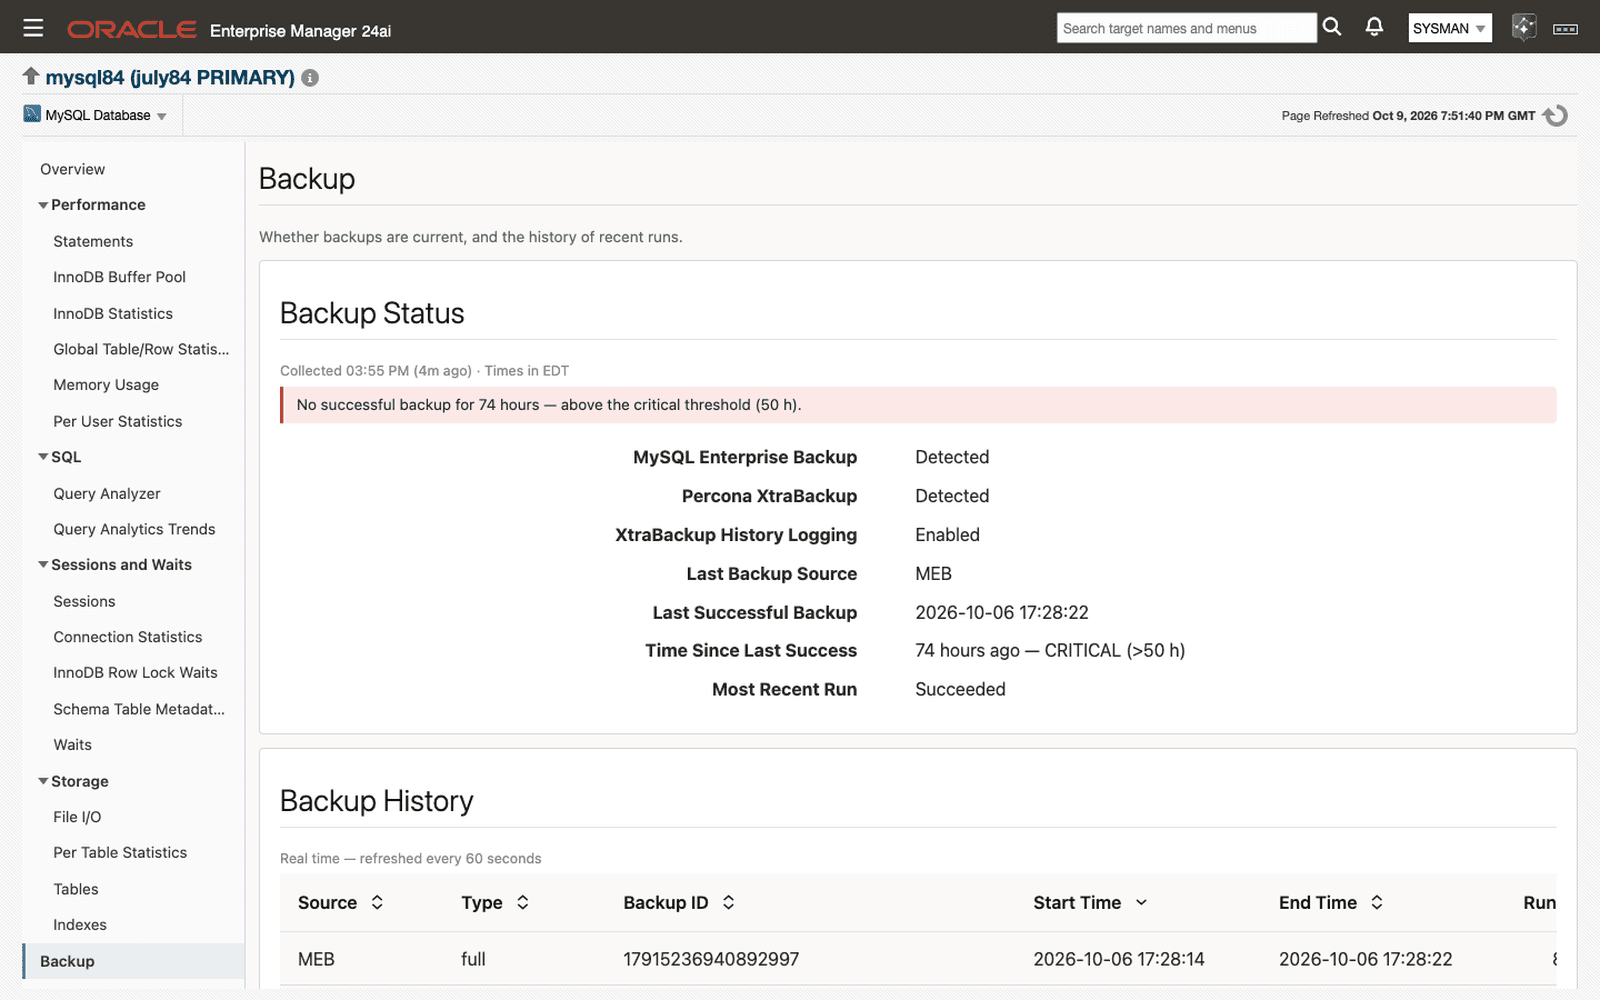
Backup Monitoring
Reads the backup history that MySQL Enterprise Backup and Percona XtraBackup record in the server and states whether this server's backups can be trusted right now. Three thresholds ship: hours since the last successful backup (warning at 26, critical at 50), last backup failed, and no successful backup. XtraBackup does not record failed runs, so for XtraBackup the backup-age threshold is the failure signal. On an InnoDB Cluster, a warning fires when the member the last MySQL Enterprise Backup run came from is no longer online.
Read-Only by Design
Collections run from an Oracle EM Management Agent over JDBC with an ordinary read-only MySQL account, so nothing is installed on the database host. Monitoring Readiness shows the SQL to fix a gap but never runs it, and EXPLAIN never executes the statement.
28 Purpose-Built Pages
Twenty-two pages for each MySQL server, four for each InnoDB Cluster, and two for each InnoDB ClusterSet, in the target navigation of Oracle Enterprise Manager.
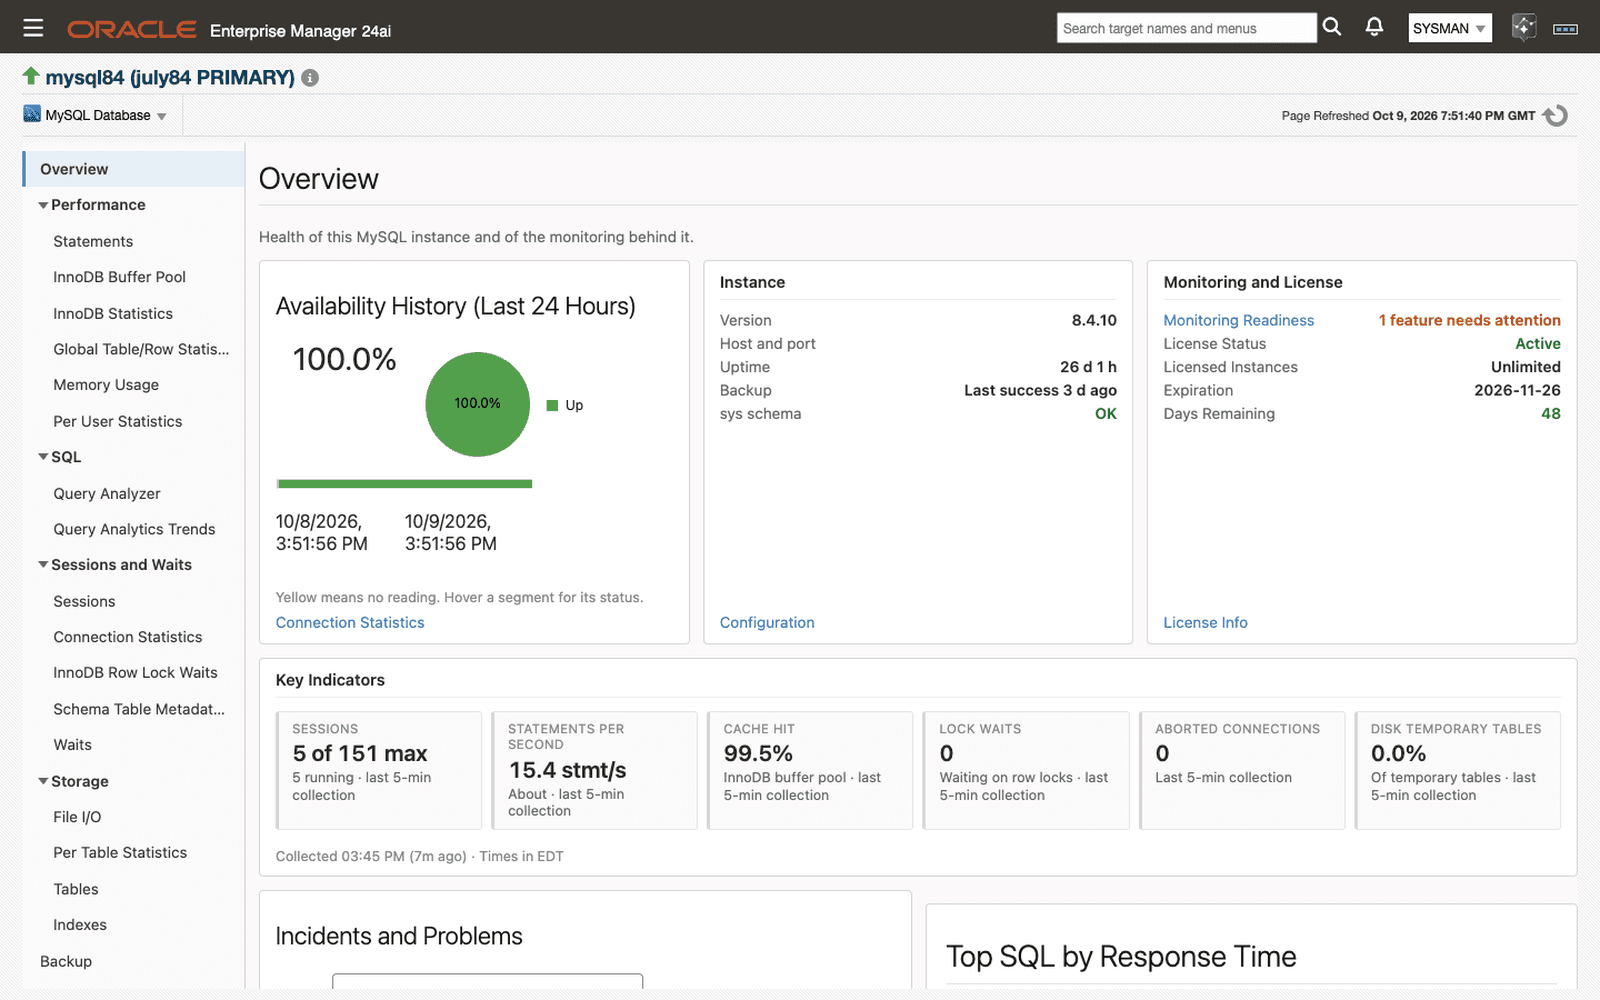
Overview
Availability, version, uptime, backup and license status, six key indicators, open incidents, and the top SQL by response time.
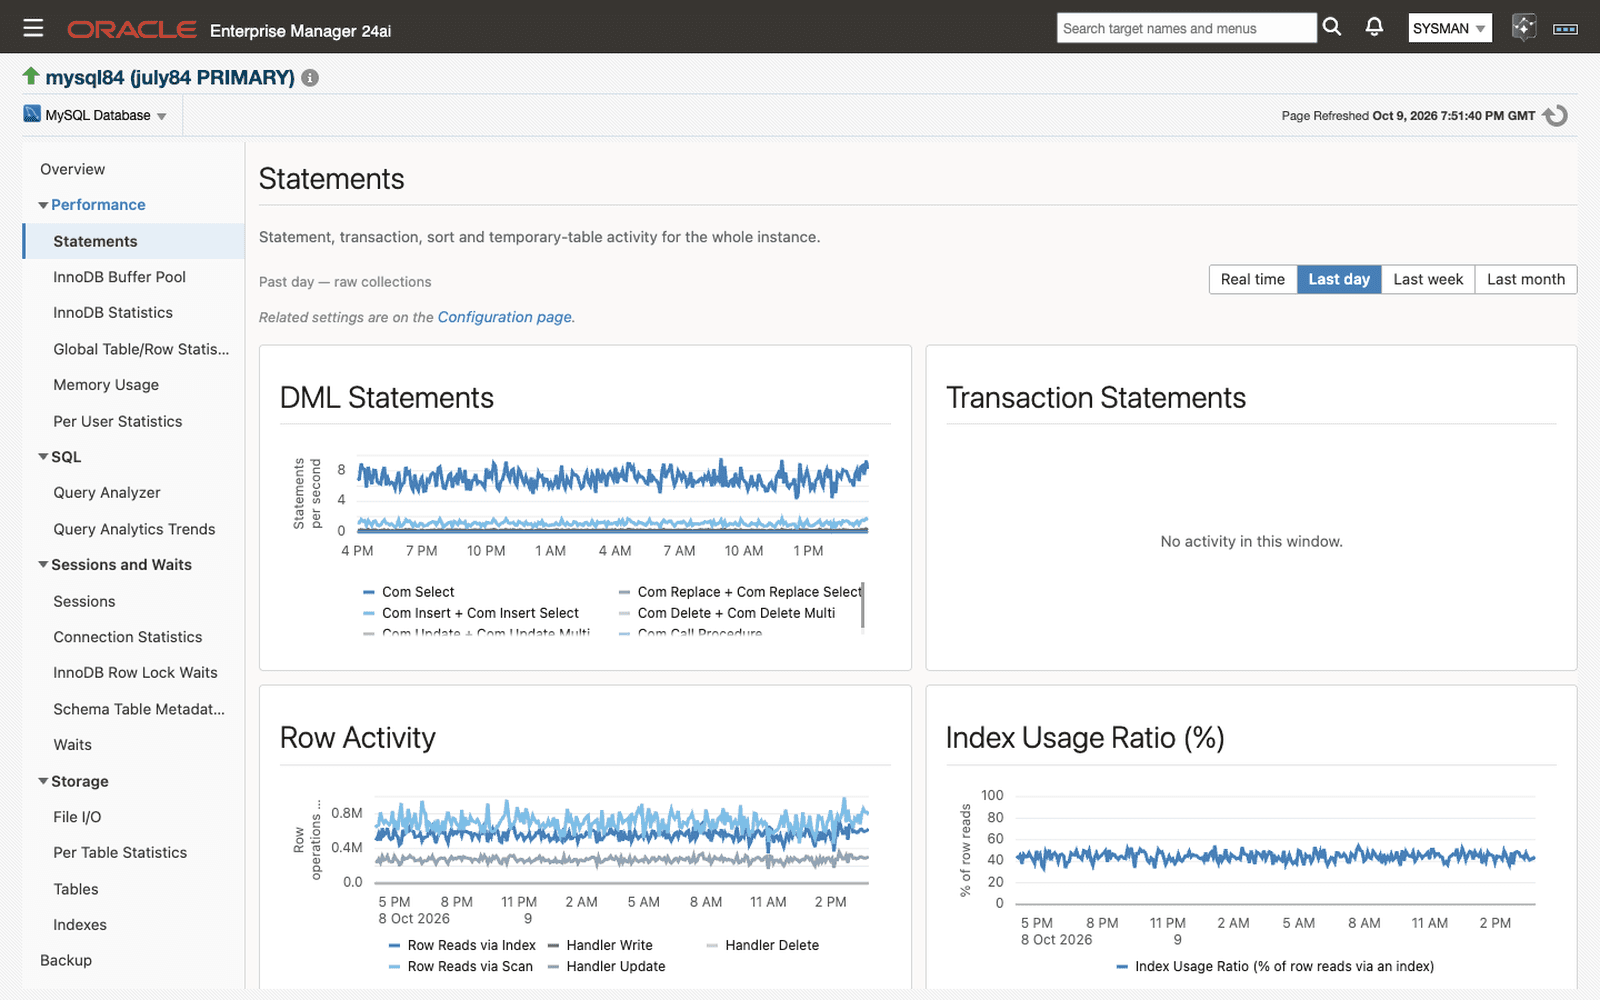
Statements
DML and transaction mix, row operations, index usage, and temporary-table and sort activity, live or over the last day, week, or month.
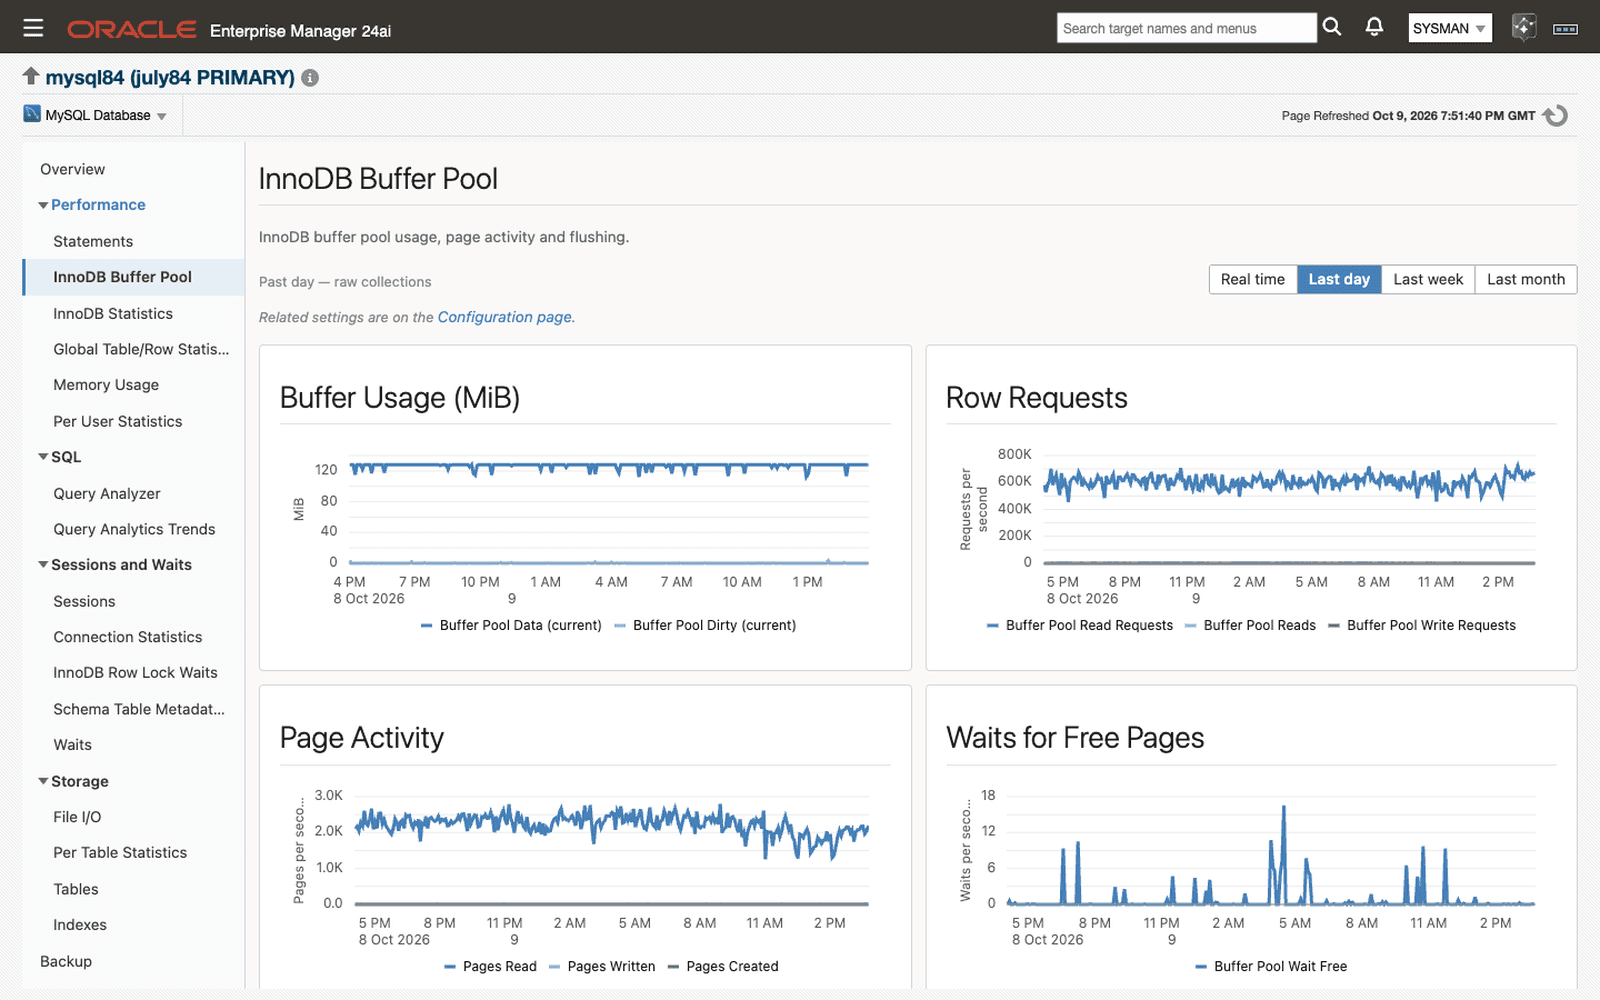
InnoDB Buffer Pool
Buffer usage, row requests, page activity, flushing, and how the pool is divided.
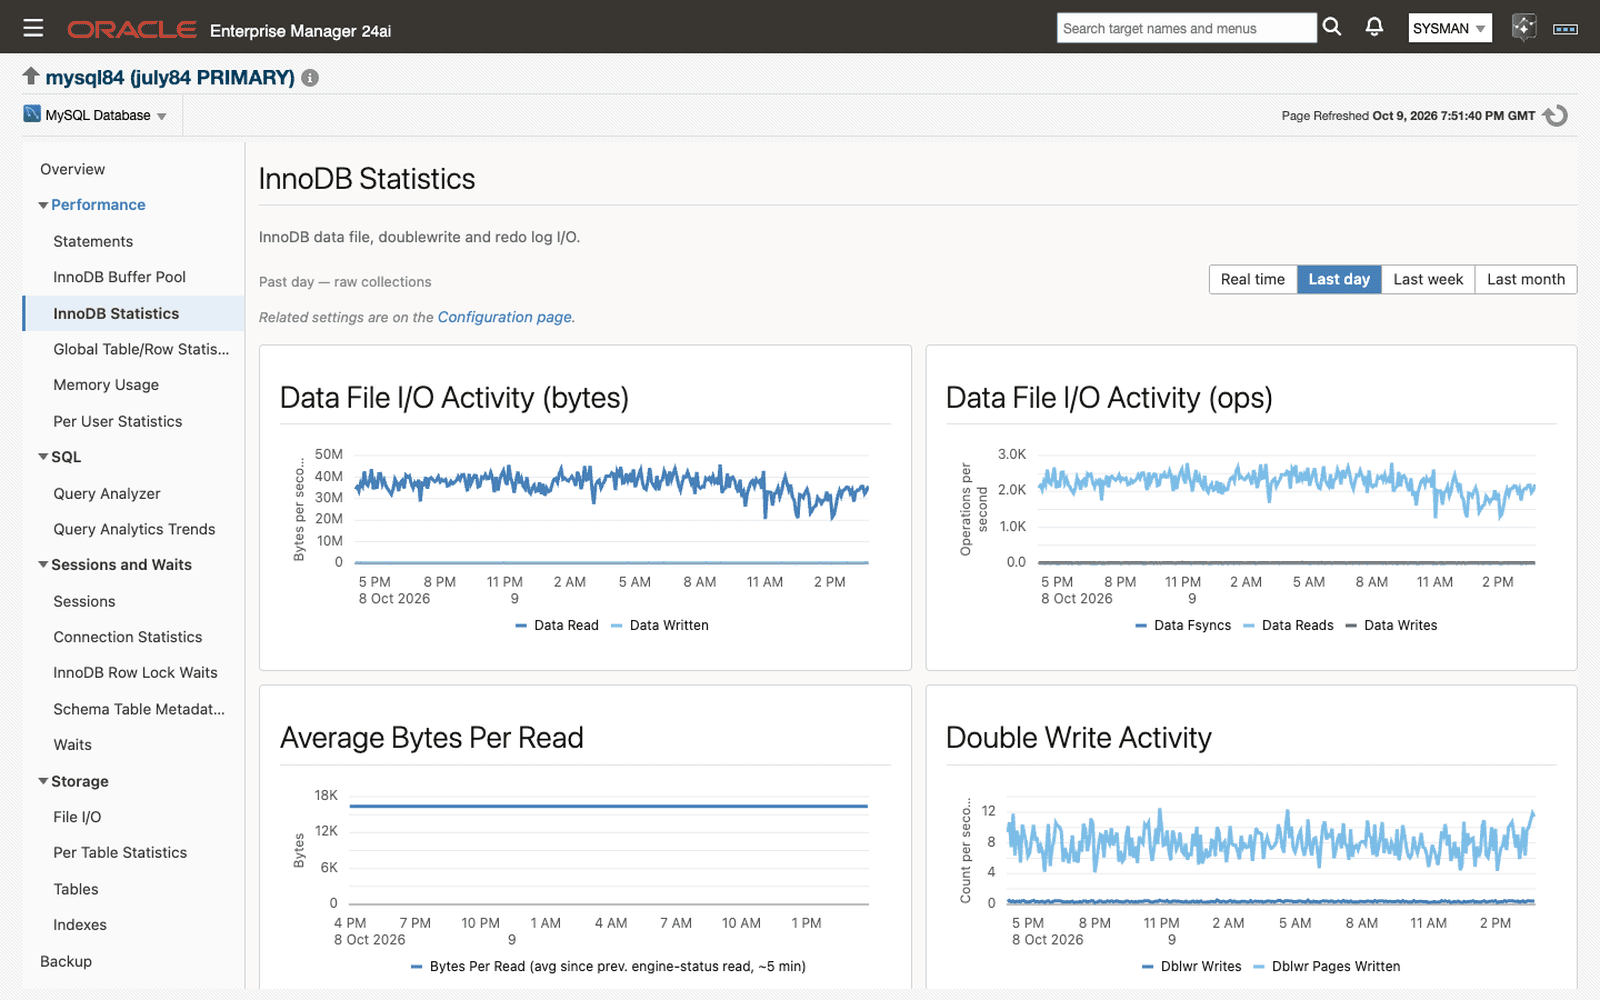
InnoDB Statistics
Data file, doublewrite, and redo log I/O.
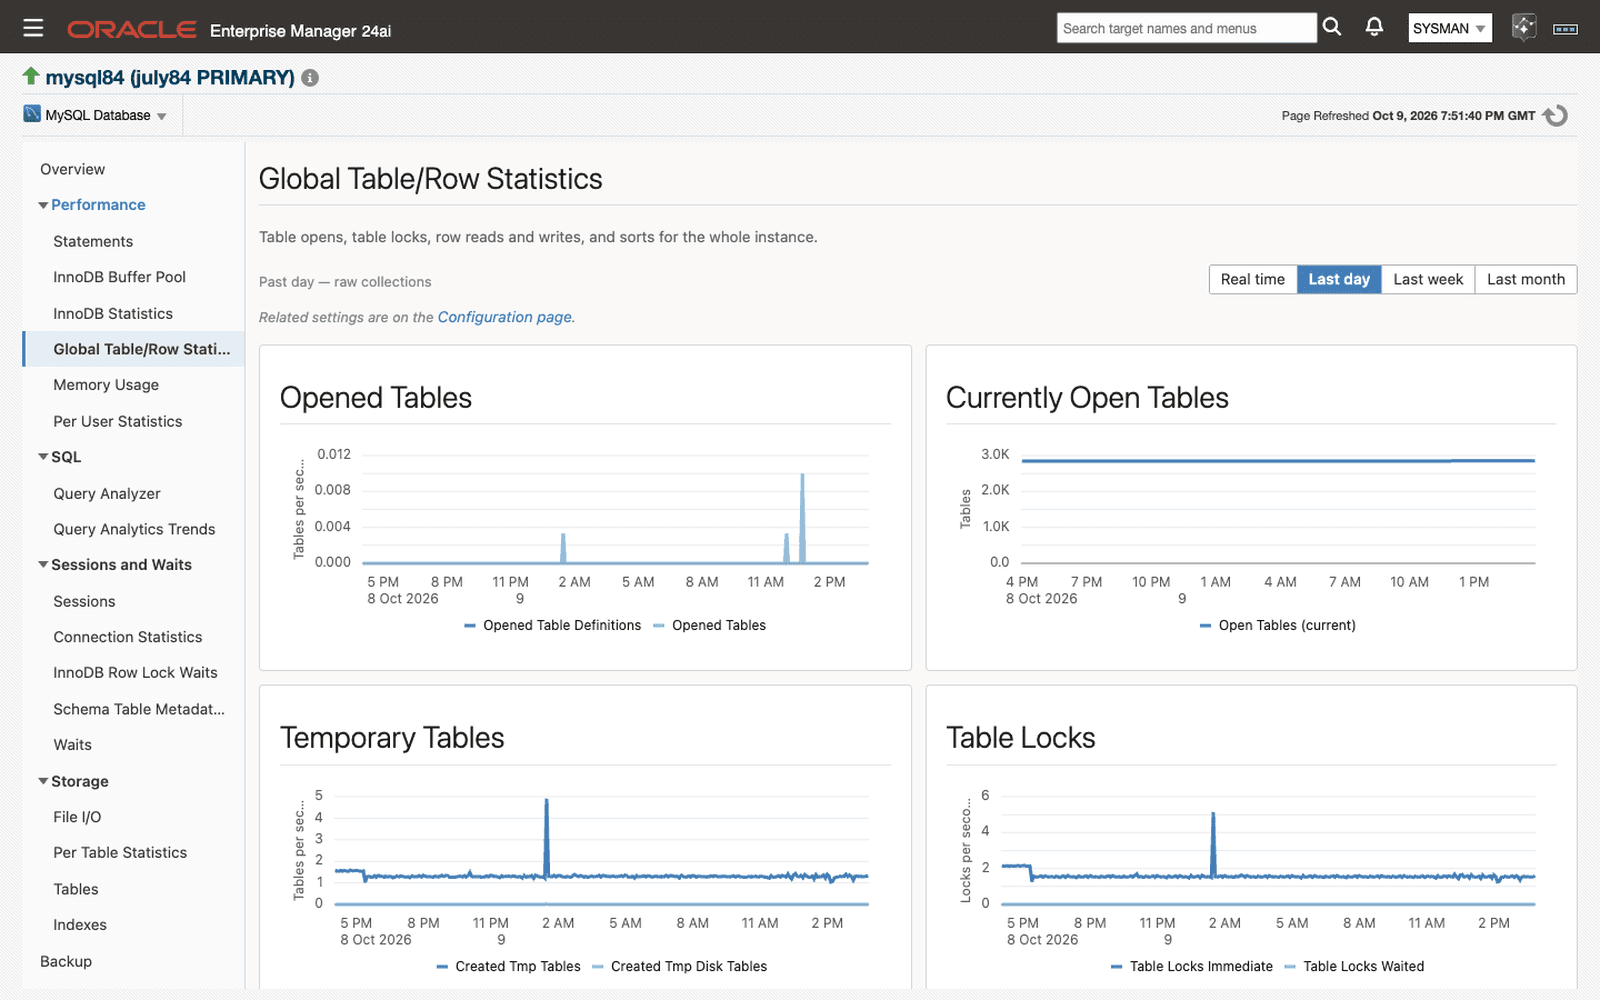
Global Table/Row Statistics
Table opens and locks, temporary tables, scan ratio, and sorts for the whole instance.
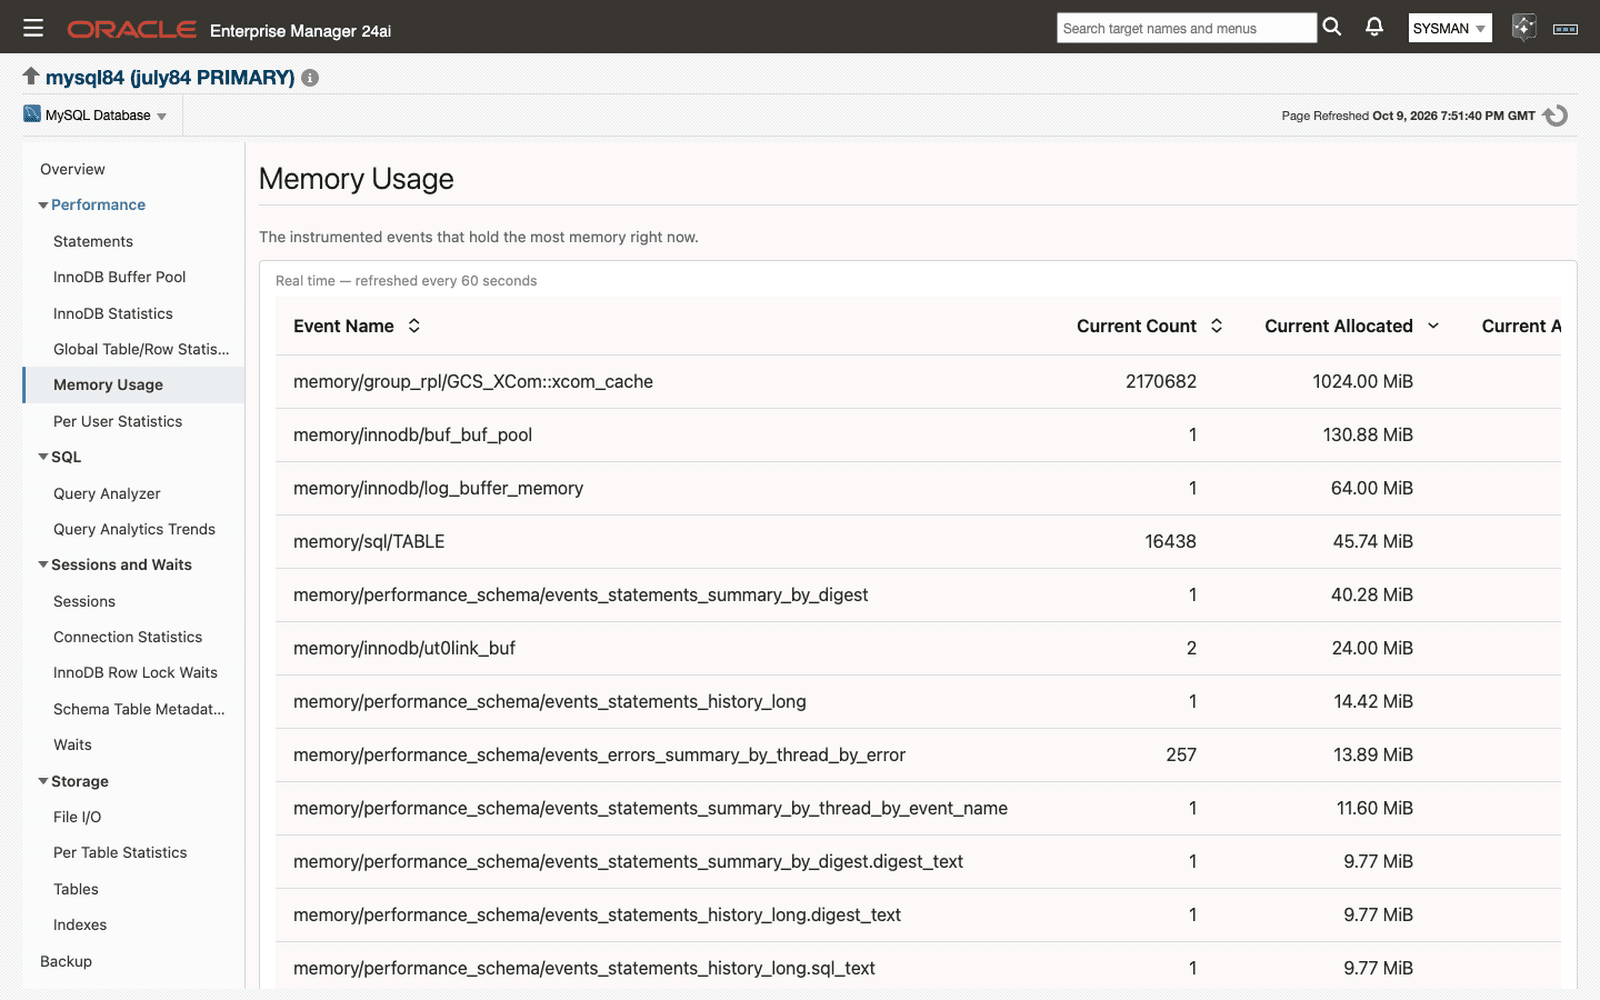
Memory Usage
Instrumented memory by event, ranked by current allocation.
Query Analytics Trends
Statement latency and volume per collection, and the heaviest statements over the last day, week, or month.
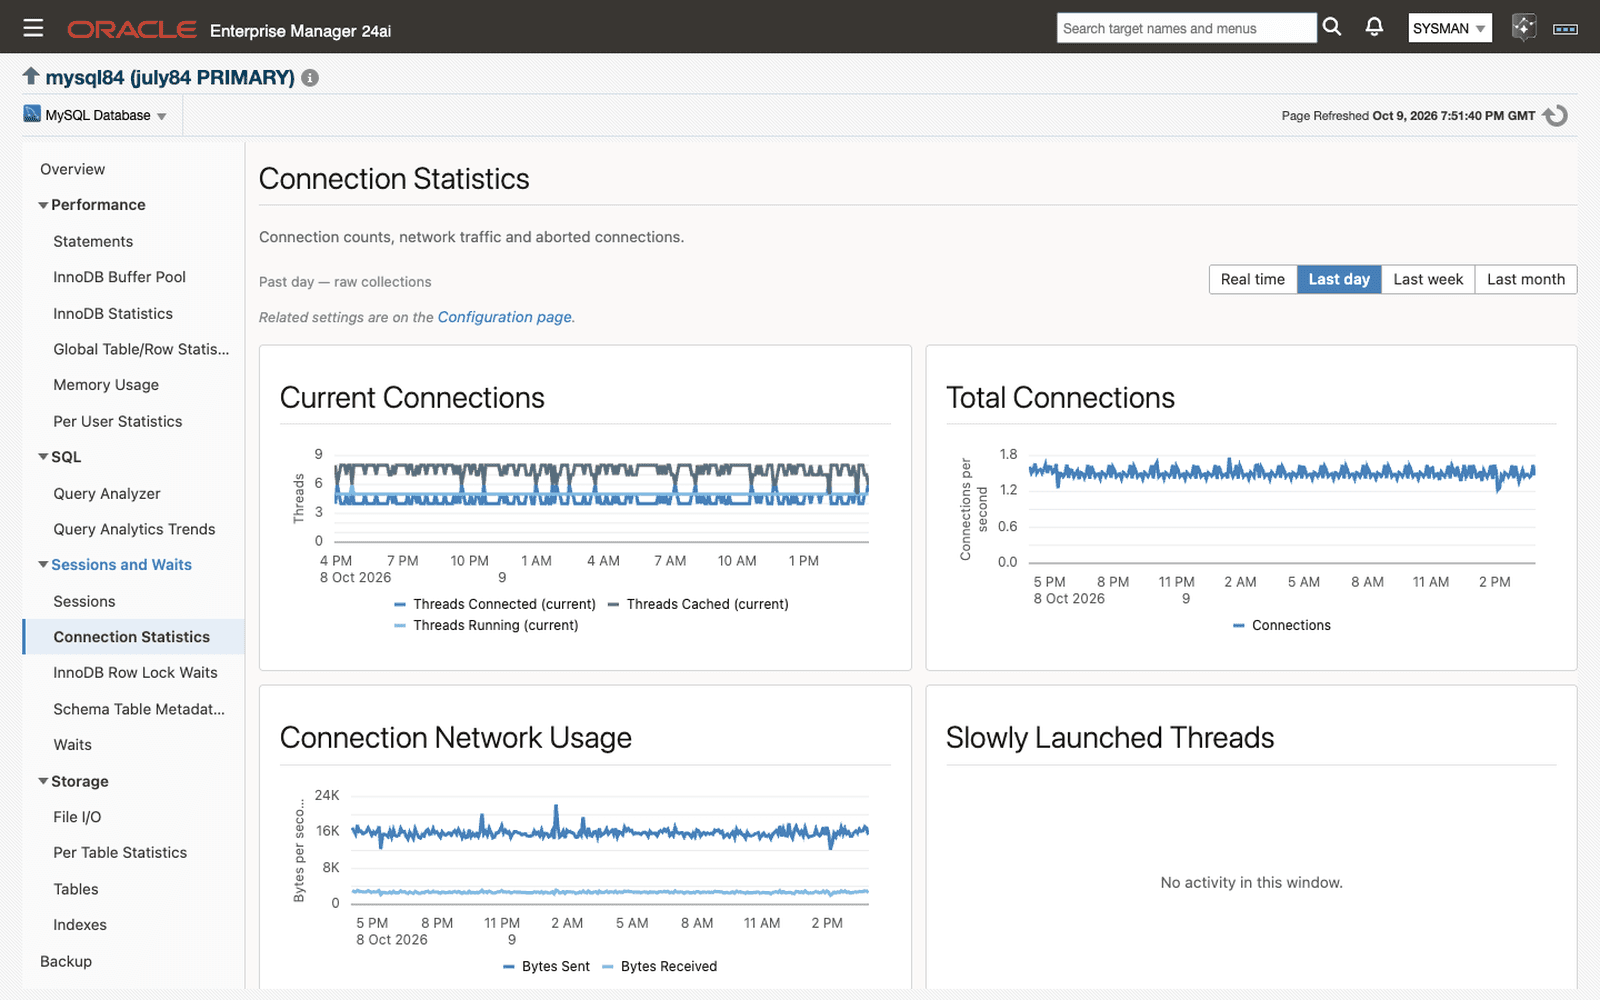
Connection Statistics
Connection counts, network traffic, thread activity, and aborted connections.
Waits
Wait time by class and by event over the last day, week, or month.
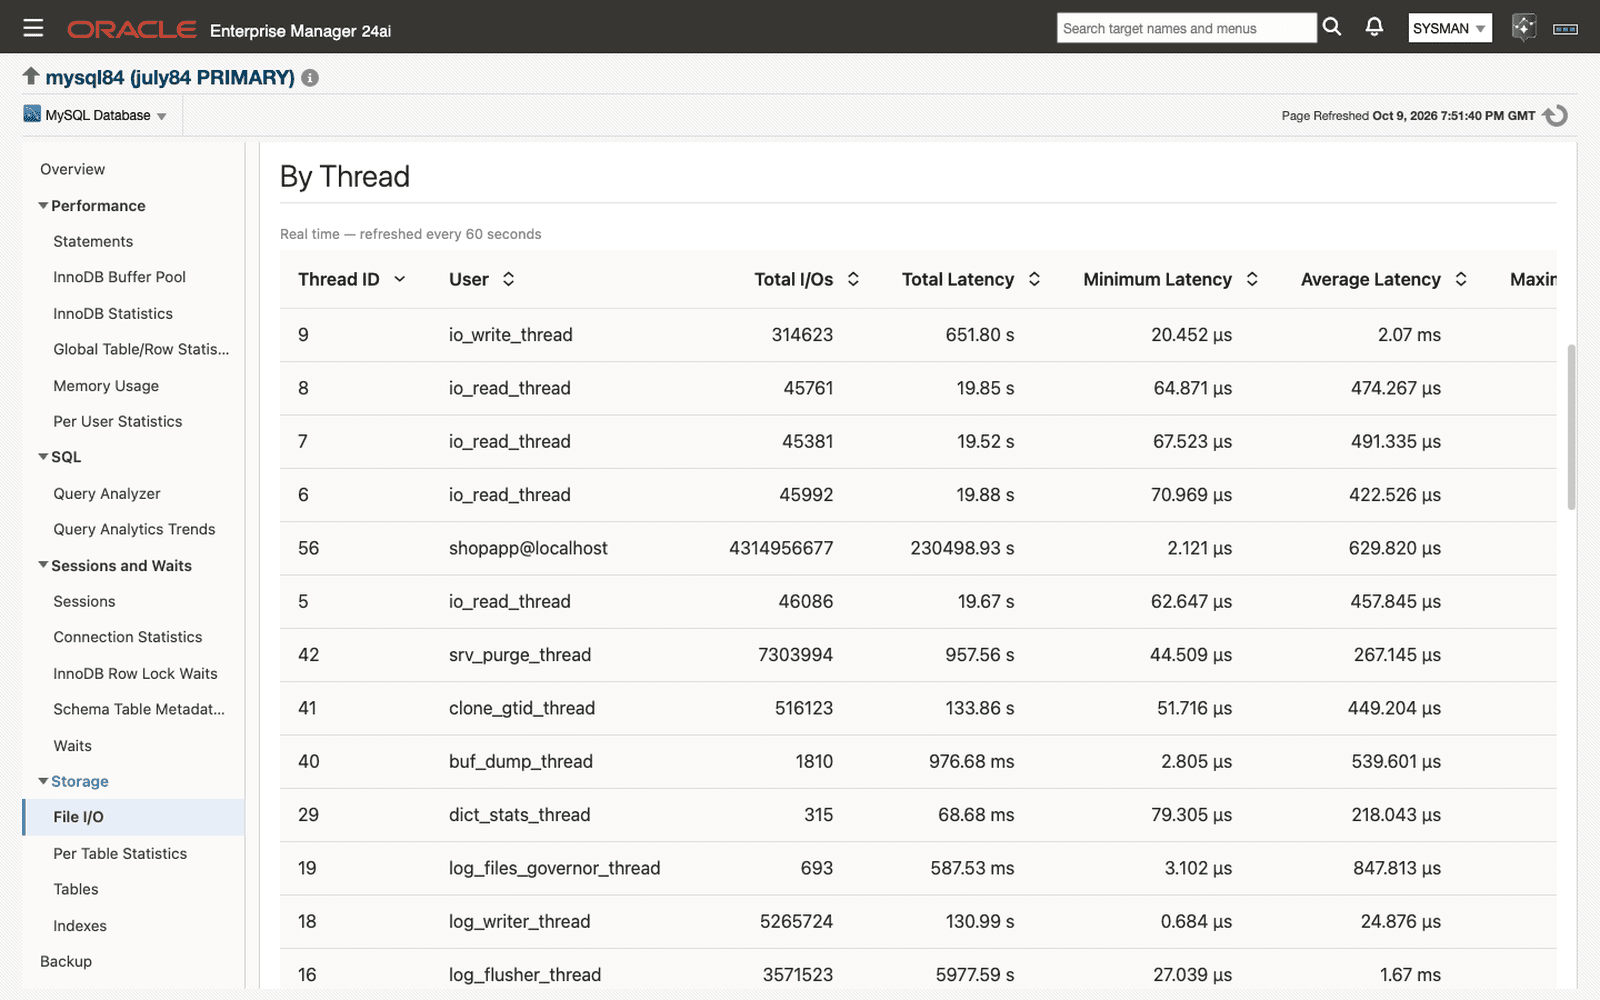
File I/O
File I/O by host, by thread, by file, and by wait event type, in four regions on one page.
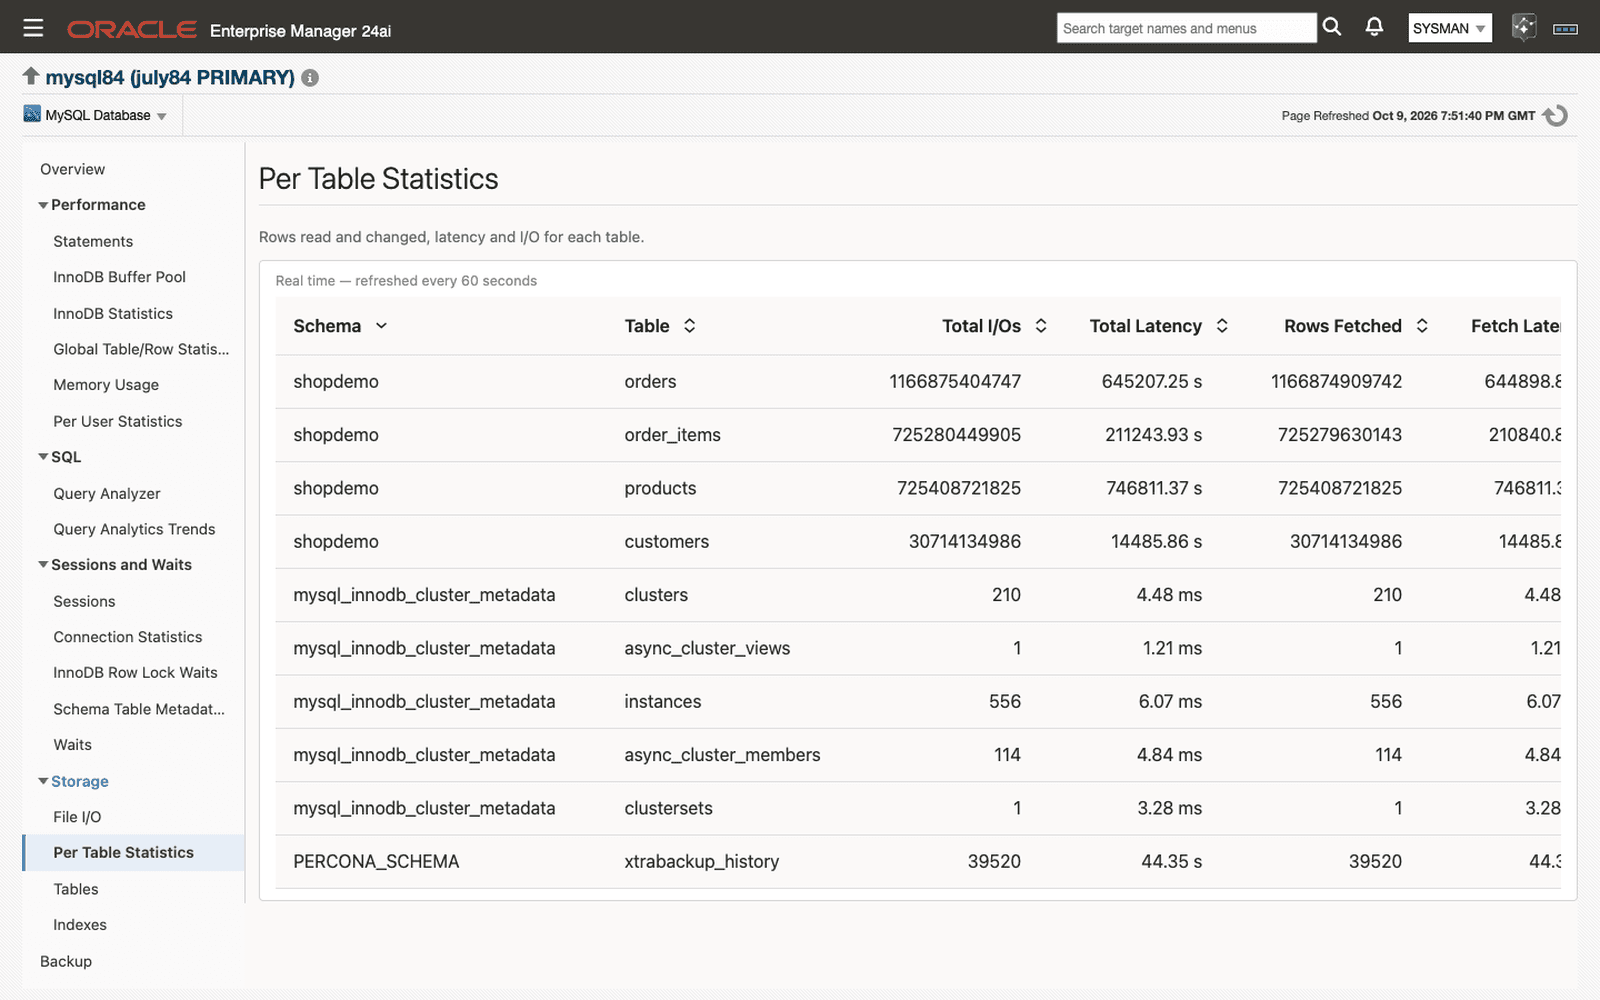
Per Table Statistics
Rows read and changed, latency, and I/O for each table.
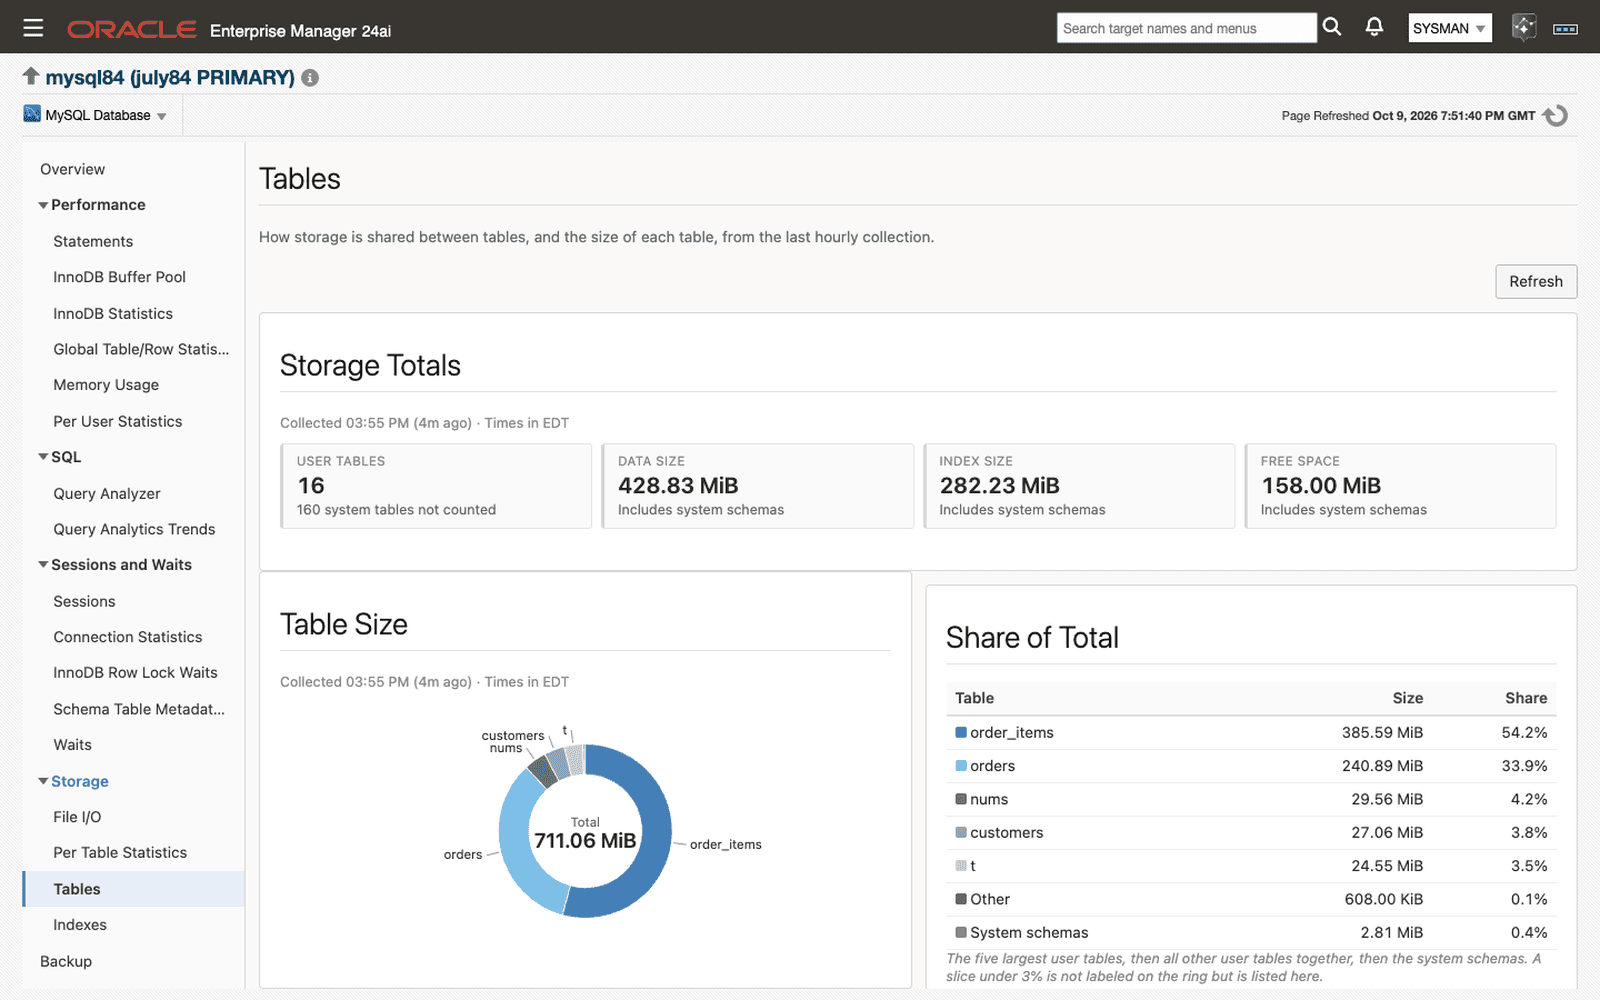
Tables
Storage by table, with data, index, and free space, from the last hourly collection.
Indexes
Index size and cardinality, with full-scan, unused, and redundant index findings.
Backup
Backup status and run history from MySQL Enterprise Backup and Percona XtraBackup.
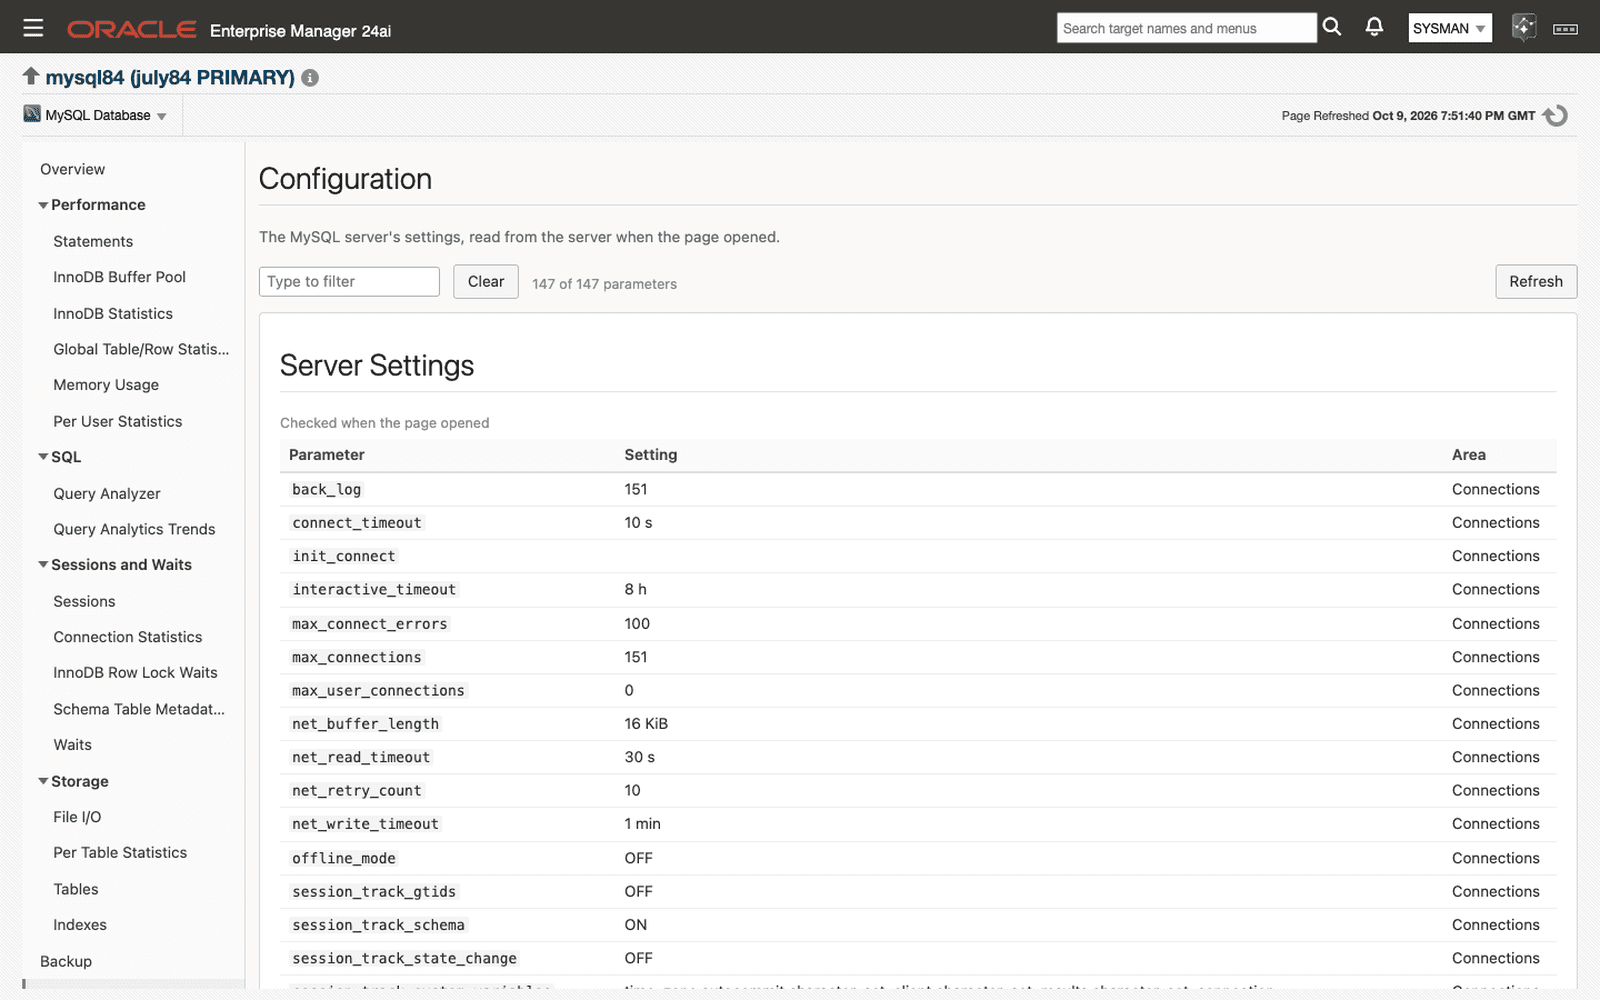
Configuration
Key server settings in eight areas, in one filterable table, linked from each chart page.
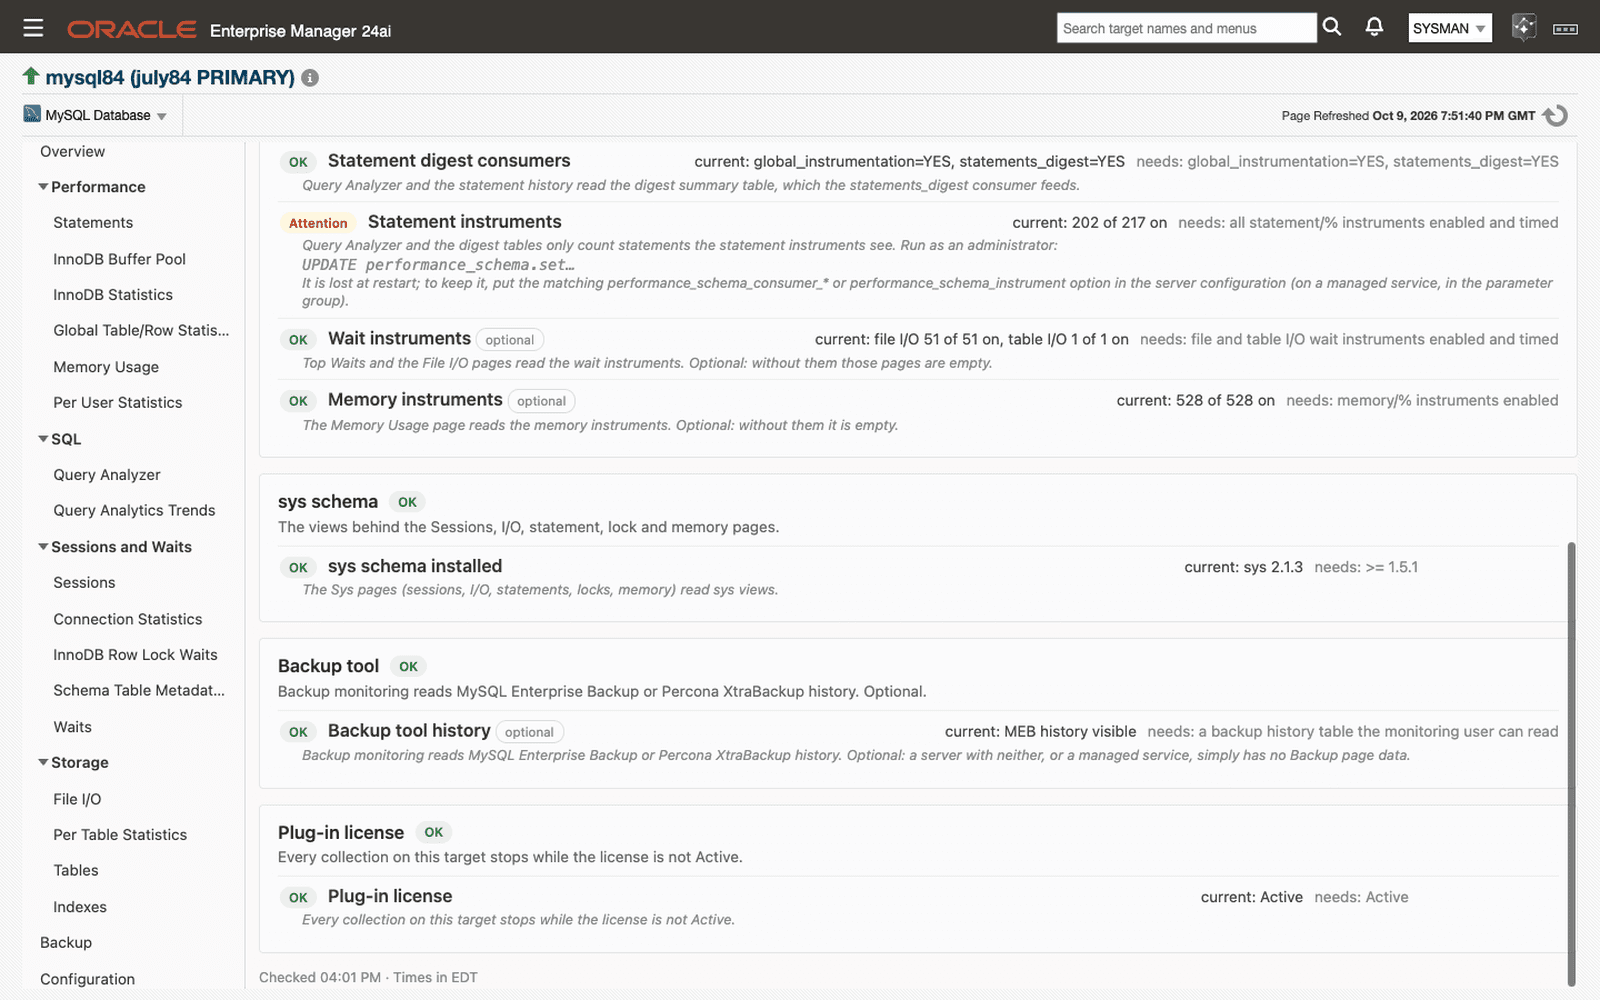
Monitoring Readiness
Live, read-only checks of privileges, performance_schema, the sys schema, backup tools, and the license, with the SQL to fix each gap.
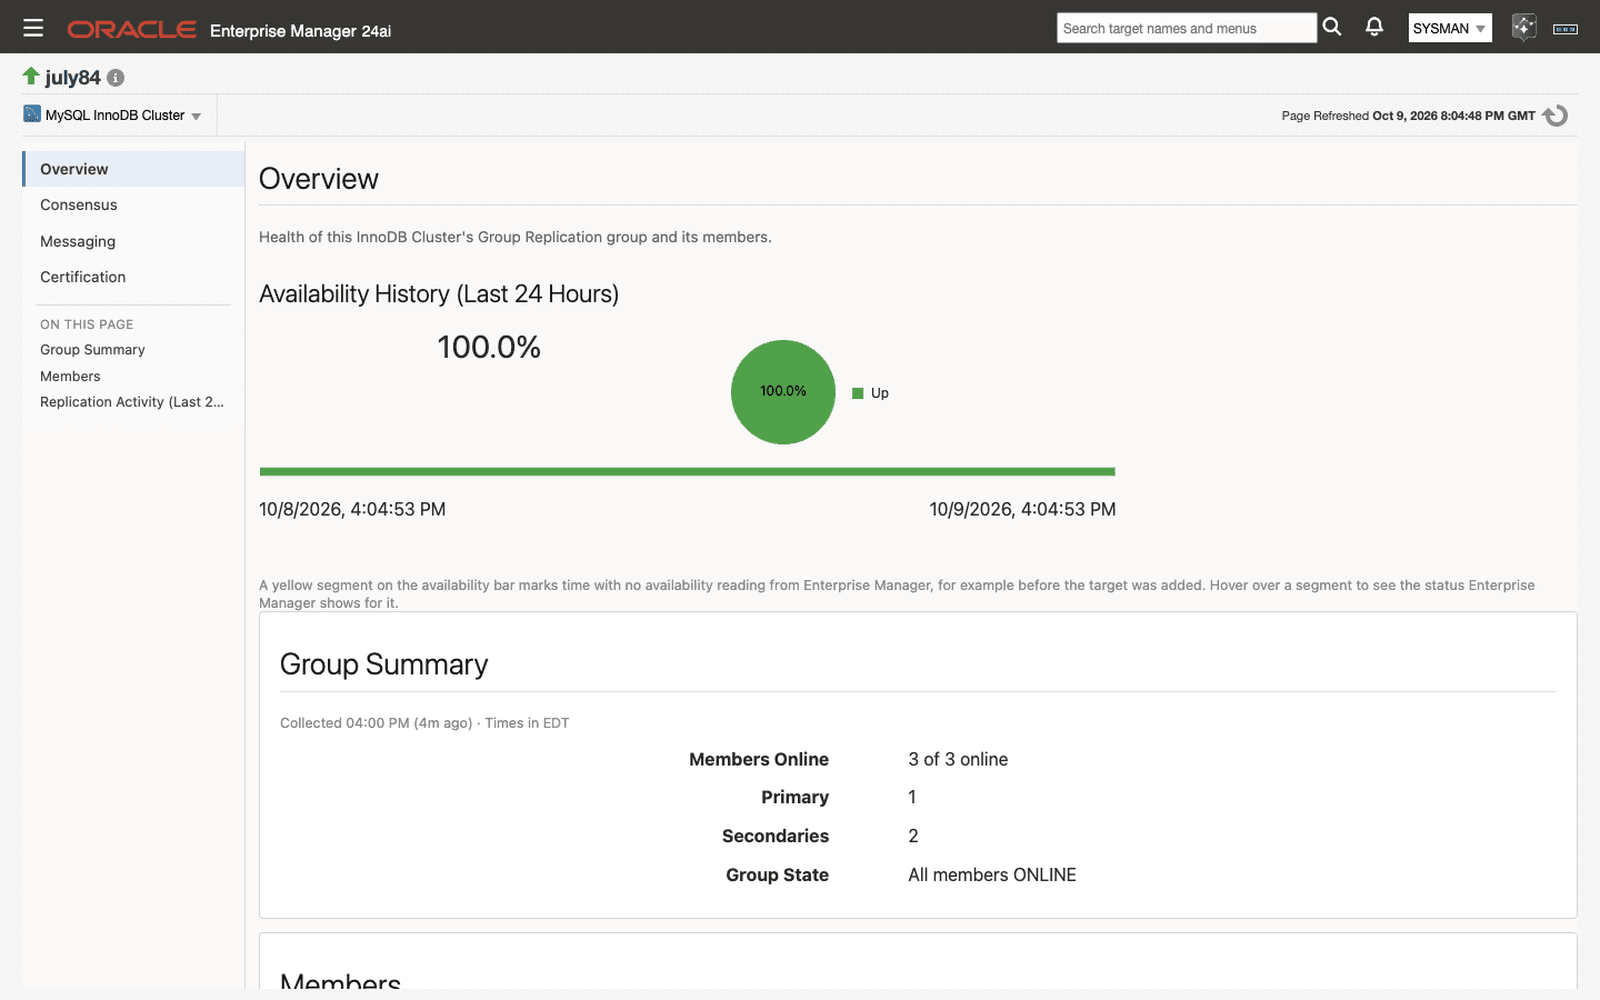
Cluster: Overview
Group summary, each member's role, state, and version, and per-member replication queues over the last 24 hours.
ClusterSet: Overview
The DR promotion readiness verdict, its contributing signals, and every cluster's role, status, and transaction set consistency.
More pages
Per User Statistics
Statements, latency, table scans, file I/O, and connections for each MySQL account.
Query Analyzer
Top statement digests by latency, execution count, or first seen, with an on-demand Explain Plan.
Sessions
Active sessions and the statement each one is running.
InnoDB Row Lock Waits
Every InnoDB row lock wait in progress, pairing the waiting session with the one blocking it.
Schema Table Metadata Lock Waits
Sessions waiting on a table metadata lock, and the sessions holding it.
License Info
The license this target runs under: customer, type, expiry, and instance count.
Cluster: Consensus
Per-member Group Replication consensus proposals, consensus time, and extended rounds.
Cluster: Messaging
Per-member message traffic and round-trip times, to separate a network problem from a database one.
Cluster: Certification
Per-member certification and consistency-wait activity.
ClusterSet: Monitoring Readiness
Live checks of the monitoring connection and of MySQL Shell on the agent host, which the DR readiness verdict depends on.
Enterprise Capabilities
Alerting, compliance, configuration history, and connection options for MySQL, inside Oracle Enterprise Manager.
Default Thresholds
Twenty-two thresholds ship set, plus an availability condition on each target type: replica lag and stopped replication threads, buffer pool hit rate, history list length, aborted connections, connection saturation, disk temporary tables, sys schema availability, backup age and failures, backup source offline, waits, Group Replication queues and consensus time, ClusterSet DR readiness and monitoring fallback, and license status and expiry. Incidents route through your existing Oracle EM rules.
65 Compliance Rules in Five Standards
Security (36 rules), Administration (14), Replication (11), Performance (2), and Schema (2), ready to associate with no rule authoring. Account-privilege rules count privileges granted through roles, and one rule flags a MySQL series past end of life.
Configuration History
Thirty-nine configuration groups are collected daily and feed Oracle EM's configuration history and comparison, so a settings change on any server can be found and compared.
Monitoring Readiness
Checks each MySQL Database and ClusterSet target live, under its own monitoring credentials, and shows what is set now, what is needed, and the SQL to fix a gap. The page only reads. A downloadable troubleshooting guide is written for use with an AI assistant.
Connection and Authentication Options
Password, Unix socket through a local agent, or Kerberos, chosen per target. TLS Mode required fails closed instead of falling back to plaintext; the certificate-verifying TLS modes are not available in this release.
InnoDB Cluster and ClusterSet Endpoints
Cluster and ClusterSet targets accept a comma-separated list of members or MySQL Router endpoints and try them in order, so a target stays Up when one member is lost. Cluster pages cover Group Replication membership, consensus, messaging, and certification.
Discovery and Bulk Onboarding
The agent discovers each local mysqld by its listening port. Managed services, including Amazon RDS, are added manually, and a downloadable onboarding script exports an estate to CSV, creates the targets with EM CLI, verifies them, and associates the five compliance standards.
Unified Monitoring
MySQL servers, InnoDB Clusters, and InnoDB ClusterSets appear in the same console, target navigation, incident rules, and compliance results as your Oracle Database, host, and middleware targets.
Compatibility
Supported versions and platforms, and what each agent host needs.
MySQL
8.4 LTS and 9.7 LTS (certified) · 8.0 (supported; end of life April 2026) · InnoDB Cluster on 8.4 (certified) · InnoDB ClusterSet (validated on 9.5; requires 8.0.27 or later) · Amazon RDS for MySQL 8.4 (certified) · Aurora MySQL, Cloud SQL, and Azure Database for MySQL (supported, added manually)
Oracle Enterprise Manager
24ai (24.1) certified; 13.5 supported, with a separate plug-in build for each
Operating Systems
Linux x86-64 Management Agents, local or remote; a local agent is needed only for Unix-socket connections. Windows agents are not supported.
Prerequisites
MySQL Connector/J on each agent host (8.4.0 tested; licensed separately, not bundled) · MySQL Shell on the agent host for ClusterSet targets · performance_schema and the sys schema for the statement, wait, and index pages
How It Works
Prepare MySQL and the Agents
Create a read-only monitoring account. Place MySQL Connector/J on each agent host, and install MySQL Shell there if you monitor an InnoDB ClusterSet.
Deploy the Plug-in
Import the plug-in archive that matches your Oracle EM version with emcli, then deploy it to the Management Server and to each agent that will monitor MySQL.
Add Targets
Add MySQL Database, Cluster, and ClusterSet targets from the console, with emcli add_target, or in bulk with the onboarding script; MySQL Database targets on monitored hosts can also be autodiscovered. Each MySQL Database target takes its license key as a target property.
Check Readiness and Monitor
Within minutes the target is Up, and its license reads Active after the first 15-minute license check. Open Monitoring Readiness to confirm every page has what it needs, associate the compliance standards, and the shipped thresholds raise incidents with no tuning.
Get a Custom Quote
Ready to add MySQL monitoring to your Oracle Enterprise Manager? Build a quote in minutes and receive detailed pricing by email.
Ready to Unify Your Database Monitoring?
Request a trial of the MySQL Plug-in for Oracle Enterprise Manager and monitor your MySQL estate from the console you already run.