Software
IBM Db2 Plug-in for
Oracle Enterprise Manager
Monitor IBM Db2 LUW from Oracle Enterprise Manager with seven native console pages, curated alert thresholds that ship turned on, HADR takeover readiness, backup and recovery history, and three compliance standards. A local or remote agent collects over JDBC with a read-only monitoring user.
55
Metric Groups
7
Native Console Pages
40+
Default Alert Thresholds
17
Compliance Rules
What the Plug-in Answers
Six features cover the questions Db2 DBAs are paged for: can the standby take over, did the backup run, and when will a table space fill.
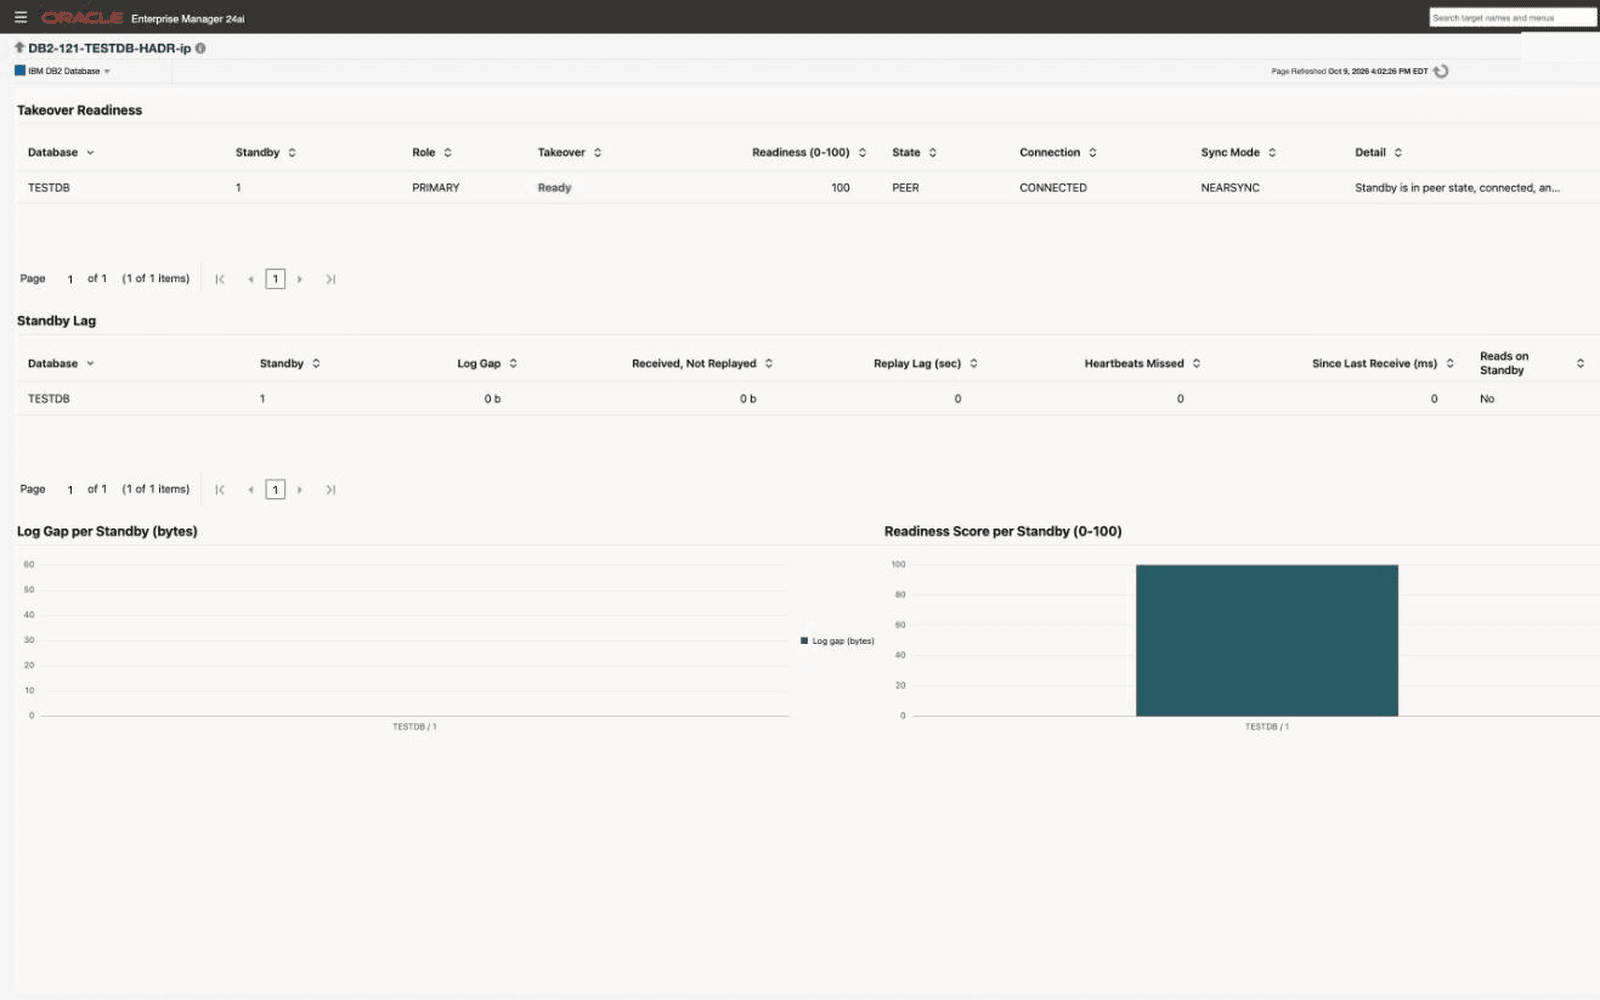
HADR Takeover Readiness
Every 5 minutes, each standby gets a verdict on whether it could take over now, a 0–100 readiness score, and the reason in plain words, backed by log-gap, replay-gap, and replay-lag columns. Shipped alerts fire when a standby is not ready, when a gap passes 10 MB or 100 MB, and when replay lag passes 60 or 300 seconds. A standby can be monitored as its own target and reads Up, not Down. With HADR alternate servers set, a target follows the primary through a takeover and back.
Backup and Recovery History
The last successful backup and the days since, plus Db2's recovery history of every backup, restore, load, reorg, and roll-forward, with failed operations and their SQLCODE marked in red. Running utilities and table-space rebalance operations are listed too. The backup-age alert warns after 1 day and goes critical after 3, and a failed operation raises a critical alert at the next hourly collection.
Days-to-Full Growth Forecast
For every table space, including auto-resize ones, a projected days to full, growth per day, and what limits growth: MAXSIZE, the file system, or fixed containers. A file-system headroom table covers each automatic-storage path. Alerts fire under 30 and 7 days to full, on a failed resize, and when a storage path's file system passes 85% or 95%.
Compliance Standards
Three standards with 17 rules evaluate on the daily configuration snapshot. Configuration Best Practices (10 rules) covers diagnostic logging, recovery, memory, TLS on the instance, and Windows extended security. Audit Posture (5) checks that an audit policy exists, is assigned, and covers the expected categories. Version Lifecycle (2) flags a release past IBM end of support or behind the latest modification pack, with the minimum levels as editable rule parameters.
SQL Analytics
Rank the top 20 statements by CPU time or by executions over the past hour, day, week, or month. A per-statement table shows executions, activity time, CPU time, lock-wait time, and rows read for each interval, and marks intervals where the statement left the package cache and its numbers undercount. SQL Analytics stores each statement's text at most once a day, up to 2,000 characters, and you can turn that collection off.
Remote Admin Jobs
Force Application, RUNSTATS on a table, and an online compressed backup with logs run as Oracle EM jobs over the target's own JDBC connection, so they work on a remotely monitored database. Each job runs with Db2 admin credentials you supply, checks every parameter before it runs, and returns Db2's own message on failure.
Findings become Oracle EM alerts
More than 40 Warning and Critical thresholds ship turned on, as ordinary Oracle EM metric thresholds that you can tune per target and route through your existing notification rules. On Oracle EM 24ai, six runbooks walk through the most common Db2 alerts: database down, table space full, transaction log filling, backup overdue, HADR standby not ready, and applications blocked on locks.
Seven Native Console Pages
Each page is part of the IBM DB2 Database target's menu in Oracle EM and reads the metric groups the plug-in already collects, with no separate reporting server.
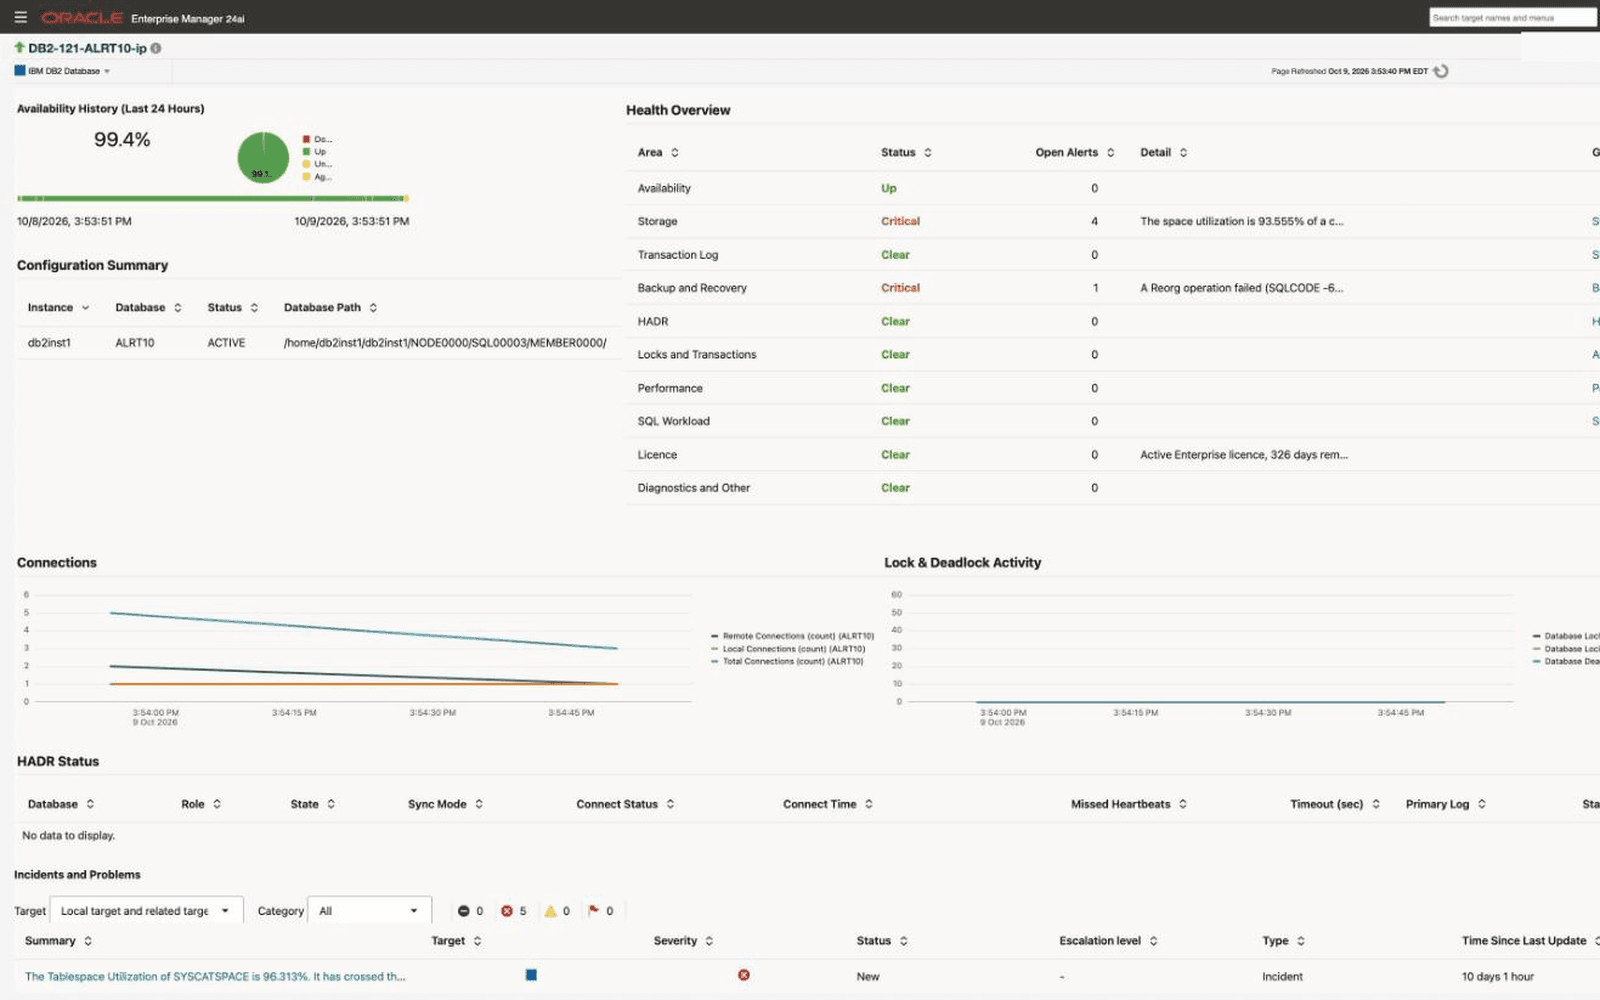
Home
24-hour and 7-day availability, a configuration summary, and a Health Overview that shows Oracle EM's own current verdict and open alerts per area, with a link to the page behind each one. Connection and lock charts, an HADR status table, related targets, and incidents complete the page.
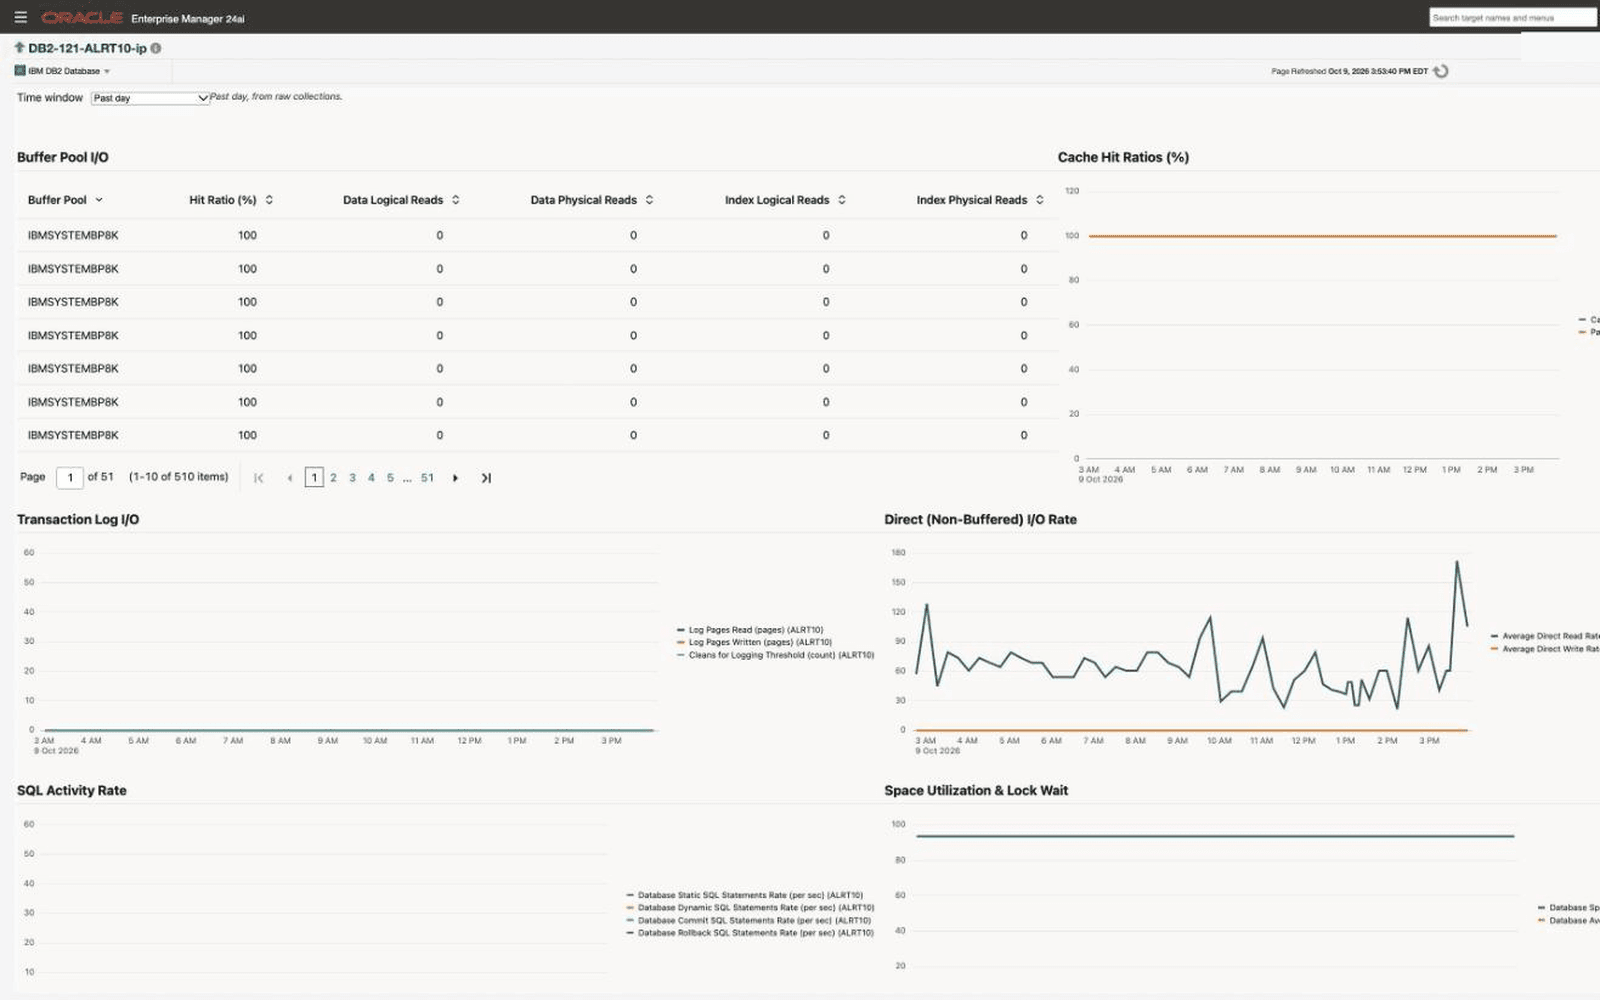
Performance
Buffer pool I/O, catalog and package cache hit ratios with their lookup counts, transaction log I/O, direct I/O rates, SQL activity rates, and space utilization with lock wait. One time window moves every region, from real time to the past month.
HADR
Takeover readiness and standby lag per standby, live bars of log gap and readiness score, log-gap and replay-lag trends over a chosen window, and the target's incidents.
More pages
Analysis
Live lock contention with the requesting and holding application, user, and statement, plus top waits by blocked and by blocking application. A Kill Blocking Application button on the blocking table asks for confirmation before it submits a job. Job activity and the target's incidents sit alongside.
Storage
Table space utilization and detail, the transaction log with the oldest transaction holding it, file-system headroom for each storage path, space and log trends, and the days-to-full growth forecast per table space.
Backup History
The last backup and days since, Db2's recovery history for backup, restore, load, reorg, and roll-forward with failures marked, running utilities, a days-since-backup trend, and table-space rebalance progress.
SQL Analytics
Top Statements by CPU time or executions, per-statement analytics for each collection interval, and top-20 bar charts of activity time and executions, all over one time window. Opening a statement shows the Statement Detail dialog, which follows that statement's CPU time and executions over the window by its statement hash.
Enterprise-Grade Capabilities
Everything listed here ships in the current release.
Curated Alerting and Runbooks
More than 40 Warning and Critical thresholds ship turned on across availability, locks, storage, the transaction log, HADR, backups, and table maintenance. They are standard Oracle EM thresholds, so tuning and notification work as they do for any target. On Oracle EM 24ai, six runbooks read the target's current values from the repository and show the fix, without running anything on the database.
Health Overview and Related Targets
Home rolls Oracle EM's current alerts up into one row per area, from storage to SQL workload, and links each row to its page. Each database is associated with the host it runs on, and an HADR primary with the standby targets it names, which places them in Oracle EM topology views.
Lock Analysis and Local Admin Jobs
The Analysis page breaks live lock waits down by blocked and blocking application. With the agent on the Db2 host, Kill Blocking Application forces the holder off after a confirmation, and start and stop instance, quiesce, unquiesce, and kill application run as Oracle EM jobs.
Least-Privilege Monitoring
The monitoring user can see how the database behaves and cannot read a row of table data. Admin jobs use their own credentials, separate from monitoring.
TLS and Encrypted Credentials
TLS with a client truststore and hostname validation is a target property, and TLS faults are reported by cause. DRDA encryption protects the user ID and password on the connection, not the data; use TLS for that. The IBM JDBC driver ships bundled, so there is nothing to stage.
Availability You Can Trust
A target reads Down only when Db2 cannot be reached. A wrong password, a missing grant, a TLS problem, or a quiesced database shows as a metric collection error that names the fix. A monitoring switch set to NONE raises an alert instead of graphing zeros.
Diagnostic Log Alerting
A curated set of db2diag.log patterns ships ready to alert, including critical-level entries, crash and trap signatures, and full table space and full log messages. Your own patterns survive plug-in upgrades. Requires the agent on the Db2 host.
Daily Configuration Snapshots
System, instance, database manager, registry, and recovery settings are captured every 24 hours as Oracle EM configuration data, with history and comparison across targets, and feed the compliance standards.
Compatibility
Certified on these Db2 versions, Oracle EM releases, and agent platforms.
IBM Db2 LUW
12.1 (certified Comprehensive) and 11.5 (certified Basic); single-partition databases and single-member editions
Oracle Enterprise Manager
13.5 and 24ai; runbooks require 24ai
Operating Systems
Linux x86-64 and Windows x86-64 agents, on the Db2 host or remote; local admin jobs and diagnostic-log alerting need an agent on the Db2 host
How It Works
Create the Monitoring User
Create a read-only monitoring user on each database.
Deploy the Plug-in
Import the plug-in into Oracle EM, then deploy it to the Oracle Management Service and to each agent that will monitor Db2. The JDBC driver is bundled.
Add Targets
Add each database as an IBM DB2 Database target with its host, port, monitoring credentials, optional TLS settings, and your license key.
Monitor and Act
Open the seven pages as data arrives. Curated alerts start on their own. Associate the compliance standards, and set admin credentials for the jobs you want to run.
Get a Custom Quote
Ready to add Db2 monitoring to your Oracle Enterprise Manager? Build a quote in minutes and receive detailed pricing by email.
Bring Db2 into Oracle Enterprise Manager
Request a trial license key and monitor IBM Db2 from the same console as the rest of your estate.