A table's size keeps climbing. pg_stat_user_tables shows autovacuum running against it, and the dead-tuple count goes up anyway. In most cases one of three things is going on. The table's own storage parameters have moved the point at which autovacuum fires, so it fires later than the cluster settings suggest. Autovacuum fires, but not often enough for the rate at which rows are updated and deleted. Or a session, a replication slot, or a prepared transaction is holding the transaction horizon back, and no vacuum anywhere in the cluster can remove the dead rows until it lets go.
The Vacuum Advisor works through all three from PostgreSQL's own statistics catalogs. It recomputes each table's trigger point from its effective settings, estimates how much a table has already grown avoidably, names whatever is holding the xmin horizon, and tracks transaction-ID age against the wraparound limit. Every corrective statement it produces is text for you to review and run in your own tooling.
This is the third of four posts on the advisory features in the PostgreSQL Plug-in for Oracle Enterprise Manager. Part one covered the Index Advisor, and part two covered Plan Analysis and the Plan Drift Advisor.
The page, top to bottom
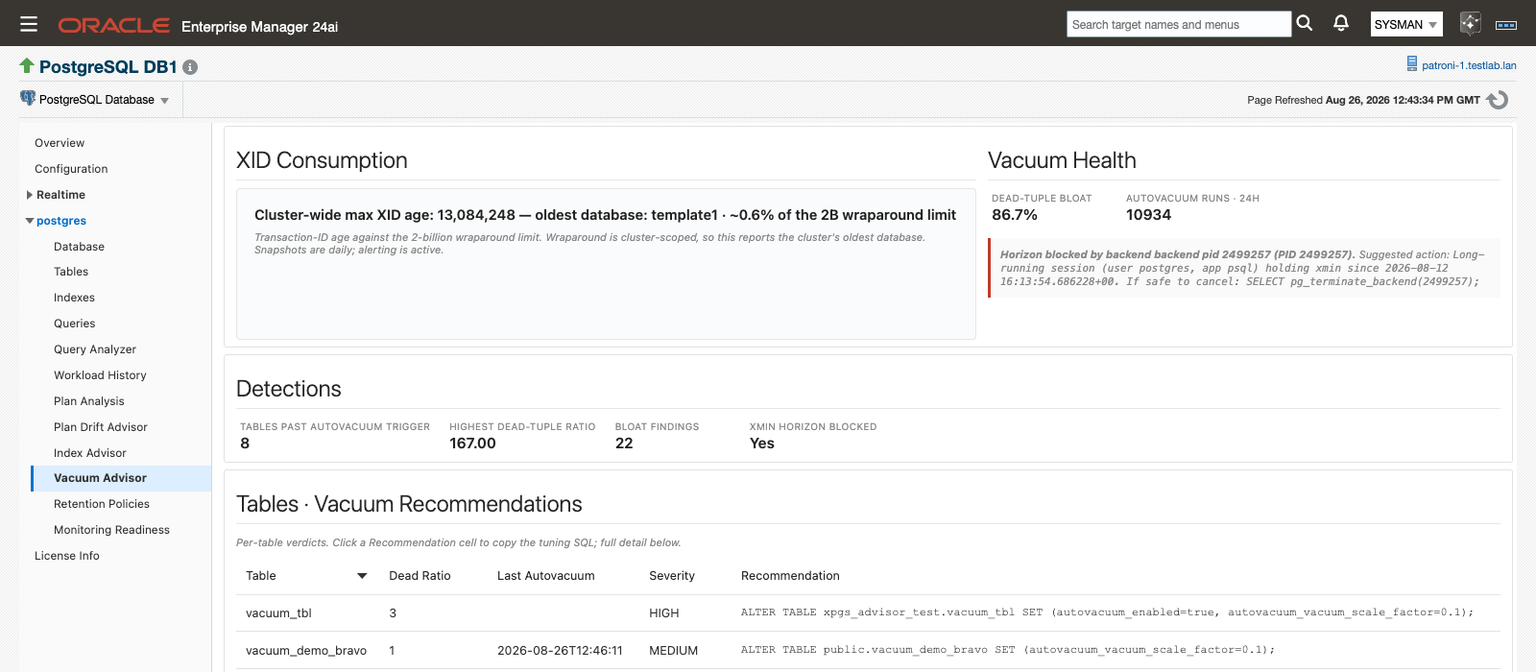
The Vacuum Advisor sits in the target's navigation tree under the database name, and in the target menu. It collects once when the page loads and does not refresh on its own, because these figures move slowly and the catalog queries behind them are heavier than most. Reload the page for fresh numbers.
The page narrows as you read down it, from cluster-wide risk to the individual table:
- XID Consumption is one line: the cluster's maximum XID age, the oldest database, and that age as a share of the 2-billion wraparound limit. Wraparound is cluster-scoped, so the line reports the cluster's oldest database rather than the one you are viewing, and that is often a template database.
- Vacuum Health has two KPIs and a card. Dead-tuple bloat is dead tuples as a share of all rows across the tables the advisor lists. Autovacuum runs · 24h counts autovacuum runs across the database over the last day, computed from daily snapshots of PostgreSQL's lifetime
autovacuum_count. It reads "—" until it has two snapshots to compare, and it is read through an Enterprise Manager job, so the target needs Preferred Credentials. Below them, the xmin horizon root-cause card turns red and names the holder and its release command when cleanup is pinned, and turns green when nothing is holding the horizon. - Detections counts what the tables below contain: tables past their autovacuum trigger, the highest dead-tuple ratio, bloat findings, and whether the xmin horizon is blocked.
- Four tables follow: Tables · Vacuum Recommendations, the per-table verdict list; xmin Horizon · Holder Detail; Per-Table Vacuum Recommendations (Full Detail), the evidence behind each verdict; and Avoidable-Growth / Bloat Estimate.
Everything except the bloat estimate reads catalogs the monitoring role can already see, such as pg_stat_user_tables, pg_class, pg_settings, pg_stat_activity, pg_replication_slots, and pg_prepared_xacts, and needs no extension.
Recomputing each table's trigger point
For every user table with dead tuples or per-table storage parameters, the advisor recomputes the dead-tuple count at which autovacuum fires:
autovacuum_vacuum_threshold + autovacuum_vacuum_scale_factor × reltuplesIt uses each table's effective settings, so a value in the table's reloptions replaces the cluster-wide setting. The Full Detail table shows the inputs side by side: dead tuples, estimated live rows, the trigger point, the effective scale factor, and the reloptions in effect. A table that has been given a high scale factor, or had autovacuum switched off, shows up here with the setting that explains it.
Each listed table gets a severity:
| Severity | Condition |
|---|---|
| HIGH | Dead tuples are past the trigger point, and the last autovacuum is missing or more than a day old |
| MEDIUM | Dead tuples are past the trigger point |
| LOW | Every other listed table |
A table with no dead tuples and no storage parameters is not listed. A healthy table that carries storage parameters is listed at LOW, so the override stays visible.
The recommendation
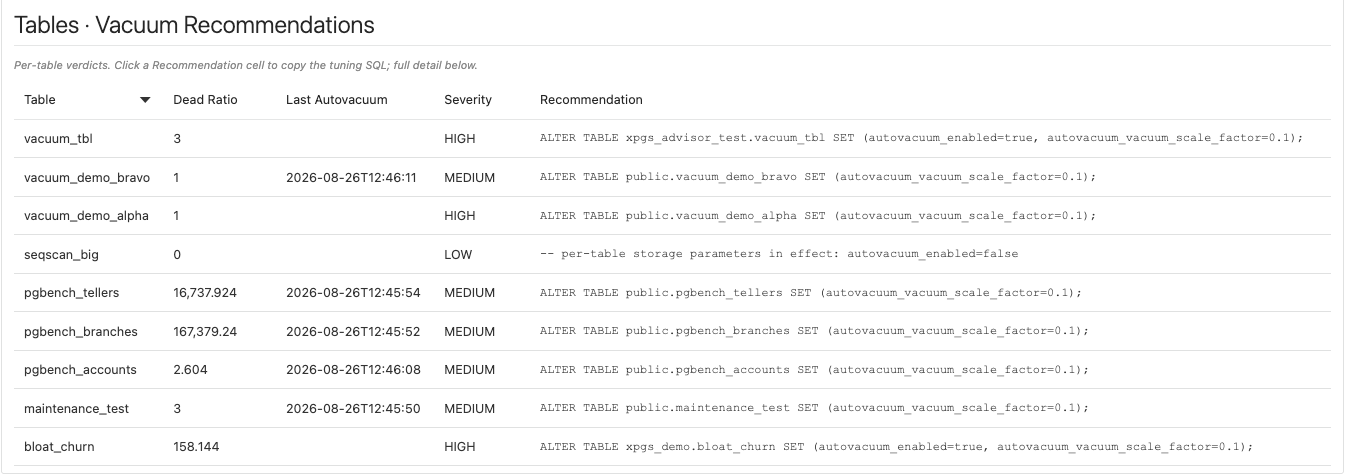
A table past its trigger point gets a statement that lowers its scale factor:
ALTER TABLE public.orders SET (autovacuum_vacuum_scale_factor=0.02);The proposed factor is the lower of two candidates: a factor that would have fired at half the dead tuples the table has now, and half the table's current effective factor, with a floor of 0.01. Above that floor, the result is at most half the current factor, so autovacuum fires sooner on that table. When autovacuum is switched off in the table's reloptions, the same statement also sets autovacuum_enabled=true, and the row's evidence sentence ends with a note that autovacuum is disabled on the table.
Tables that are not past their trigger get a comment instead of a statement: -- autovacuum is keeping up (no tuning needed), or -- per-table storage parameters in effect: followed by the table's reloptions.
To act on a row:
- Find the table in Tables · Vacuum Recommendations, which is sorted worst first.
- Read its row in Per-Table Vacuum Recommendations (Full Detail): dead tuples against the trigger point, when autovacuum last ran, and any
reloptions. - Click the Recommendation cell. The statement opens in a copy dialog.
- Review it and run it in your own tooling.
The finding clears at the next collection after dead tuples fall back under the trigger point. There is nothing to close by hand.
Bloat that has already happened
The trigger-point check shows that cleanup is falling behind. The Avoidable-Growth / Bloat Estimate shows how much a table has already grown as a result: its free space and dead tuples as a share of the table.
This section needs the pgstattuple extension. Extensions are per-database in PostgreSQL, so it has to be installed in each database you want estimated. The plug-in detects it through the catalog and does not install it. Without it, this one section is empty and the rest of the page is unaffected. No extra grant is needed: the function the estimate uses requires pg_stat_scan_tables, which pg_monitor already includes.
The estimate uses pgstattuple_approx, which reads only the pages PostgreSQL has not already marked all-visible, so it does not scan whole tables. It covers ordinary permanent tables in user schemas of at least 256 KB. Each database's estimate runs within a 30-second budget, and on a database with very many tables the smallest remaining tables are skipped once that budget is spent. A table the monitoring role cannot read is skipped and logged, and the rest of the database is still estimated.
| Severity | Condition |
|---|---|
| HIGH | Free space of 40% or more, or dead tuples of 20% or more |
| MEDIUM | Free space of 20% or more, or dead tuples of 10% or more |
| LOW | Everything else in the set |
Each row carries an evidence sentence, for example: "Table is ~46.2% free space (912 MB) with 2204118 dead tuples (~21.7%); a VACUUM (FULL) or pg_repack would reclaim the avoidable growth". The order of work follows from the two sections: address the vacuum recommendation first, so the table stops growing, then reclaim the space in your own tooling with a VACUUM, or a rewrite such as VACUUM (FULL) or pg_repack for severe cases.
What is holding the xmin horizon
Vacuum can only remove a dead row once no open snapshot might still need it. While something holds the cluster's xmin horizon back, autovacuum runs and reclaims nothing, and tuning trigger points makes no difference. On the page, this looks like Tables past autovacuum trigger rising while Last Autovacuum keeps updating.
The advisor identifies what is holding the horizon and shows the statement that would release it. It detects three kinds of holder:
| Holder Type | Read from | Suggested Action |
|---|---|---|
backend | pg_stat_activity.backend_xmin | Names the user and application and how long the session has held xmin, then SELECT pg_terminate_backend(<pid>); |
replication_slot | pg_replication_slots | For an active slot, names its PID and says to check the standby or subscriber. For an inactive slot, says it is pinning the horizon. Either way, then SELECT pg_drop_replication_slot('<slot>'); if the slot is obsolete |
prepared_transaction | pg_prepared_xacts | Names the owner, then ROLLBACK PREPARED '<gid>'; if the transaction is abandoned |
The collector excludes its own session from the list.
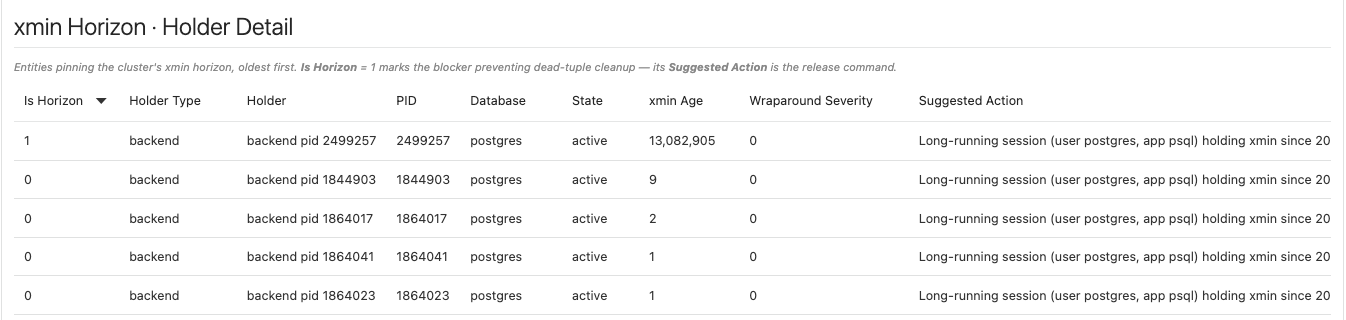
The holder list is sorted oldest first. The row with Is Horizon set to 1 is the one holding cleanup back. The others are queued behind it, and on a busy system many rows is normal. A holder with an xmin age of 0 is listed but not counted as blocking by the KPI or the root-cause card; it is typically a short transaction still in flight.
The same detection has a live view at Realtime ▸ Vacuum xmin Horizon, with Auto Refresh set to No Refresh, 15, 30, or 60 seconds. It re-queries the current state on each refresh, and the page has no action buttons.
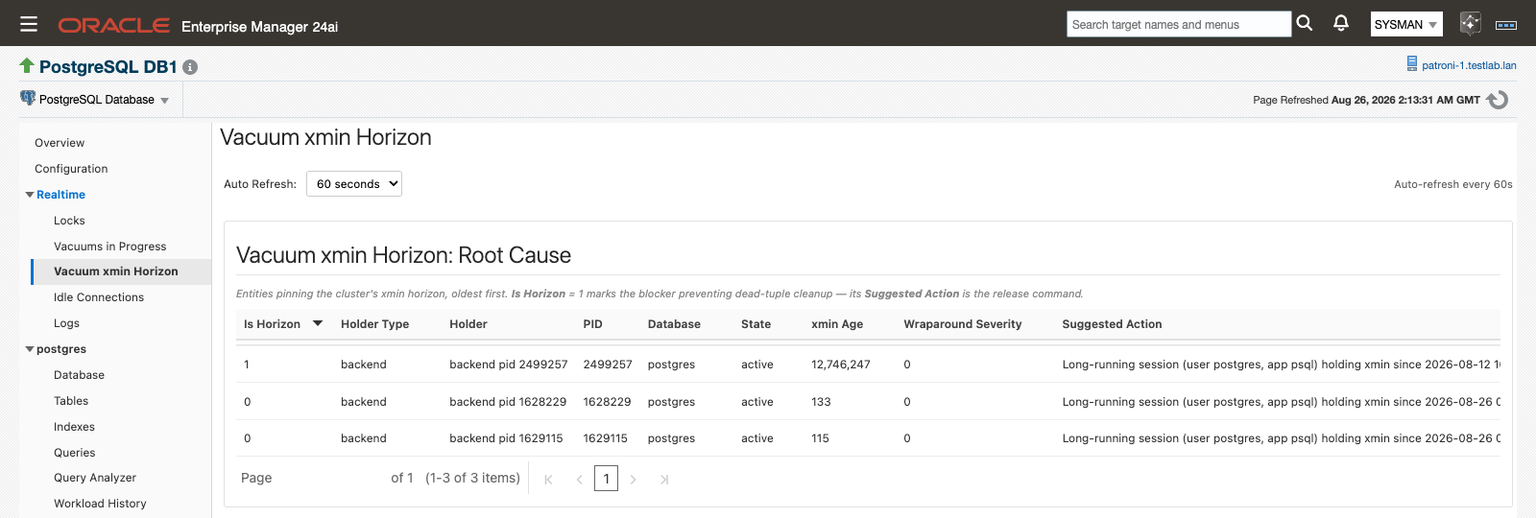
To work a pinned horizon on the live page:
- Find the row where Is Horizon is 1.
- Copy its Suggested Action, review it, and run it in your own session if it is safe to do so.
- On the next refresh, check which holder now has Is Horizon set to 1. Holders are often layered, and releasing the oldest can reveal the next.
An xmin Age that grows between refreshes means the holder is still accumulating.
Wraparound
Transaction-ID age and multixact age are tracked against the wraparound limit at both database and table level, as four separate metrics, because a database can be in good shape on one and close to the limit on the other. The thresholds ship enabled, and the XID Consumption line shows the cluster's live position.
The table-level alerts say that the table is holding back the database's datfrozenxid or datminmxid and to check autovacuum, so a table that autovacuum is not reaching raises its own alert.
Lowering the scale factor does not help with an age alert. It changes when autovacuum fires next time, and does nothing to the age a table has already accumulated; only a freeze advances relfrozenxid. Check the xmin horizon first, because a freeze cannot advance past a pinned horizon either. Once the horizon is clear, freeze the named table in your own tooling:
VACUUM (FREEZE) public.orders;Age history accumulates in the plug-in's agent-local store from the first collection, with no configuration. The daily condense keeps each day's maximum XID and multixact ages.
Watching a manual vacuum
Realtime ▸ Vacuums in Progress shows what pg_stat_progress_vacuum reports for a running VACUUM, joined to its session: the process ID, database, current phase, heap blocks total, scanned, and vacuumed, percent complete, session state, backend type, and start time. It needs no extension. It is the page to have open while a VACUUM or VACUUM (FREEZE) you started works through a table, with the same Auto Refresh choices as the xmin page.
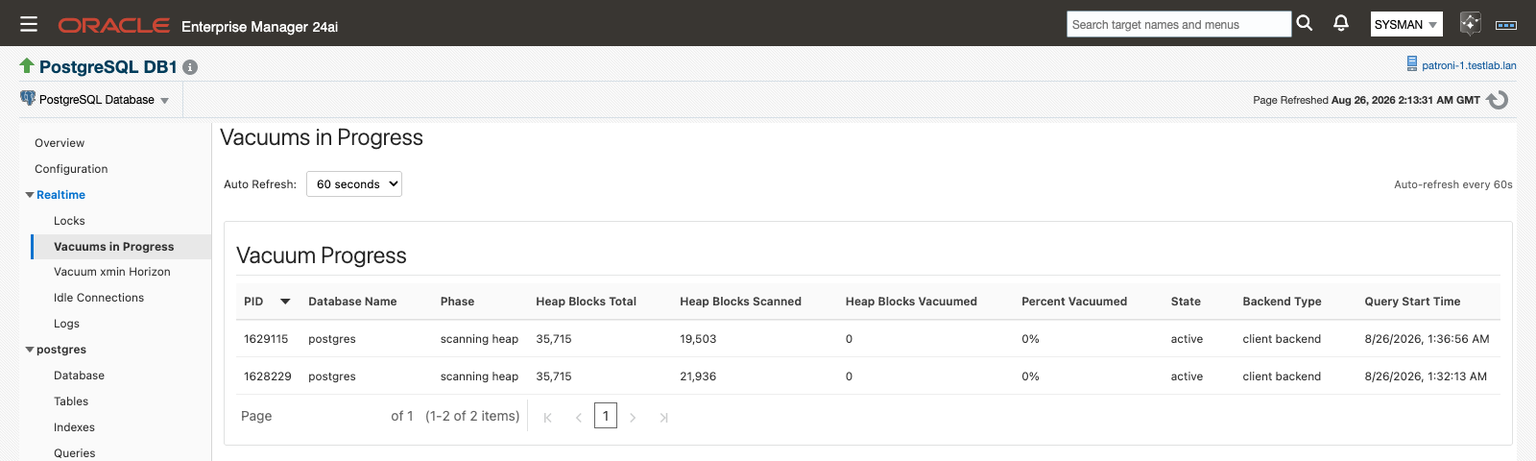
An empty table means no vacuum is running.
When a finding becomes an alert
The advisor's findings are standard Enterprise Manager metrics, with editable collection schedules, per-target thresholds, alert history, and notification routing through whatever connector you have bound. The shipped monitoring templates set them fleet-wide.
| Metric | Collected | Default Warning | Default Critical | Occurrences |
|---|---|---|---|---|
| Vacuum Advisor (Frequency) | Every 30 minutes | Severity = HIGH | Not set | 1 |
| Table Bloat Estimate | Every 30 minutes | Severity = HIGH | Not set | 1 |
| Vacuum xmin Horizon (Root Cause) | Every 30 minutes | Wraparound Severity ≥ 1 | Wraparound Severity ≥ 2 | 2 |
| Database and table XID and multixact unfrozen age (four metrics) | Every 30 minutes | 1,000,000,000 | 1,500,000,000 | 2 |
Wraparound Severity is a band on the holder's XID age: 1 at 1 billion, 2 at 1.5 billion. The xmin and age metrics require two consecutive collections over the line, so a batch job that holds the horizon for one collection does not raise an alert, and a holder still there at the next collection does. The Vacuum Advisor alert message includes the table, its dead-tuple count, its trigger point, and the recommended statement; the xmin alert names the holder and its release command.
The Vacuum Advisor does not run any of the statements it shows. The ALTER TABLE tuning, pg_terminate_backend, pg_drop_replication_slot, ROLLBACK PREPARED, and VACUUM (FREEZE) statements all appear as text to copy, review, and run yourself.
Do I need any extensions for the Vacuum Advisor?+
Only for the bloat estimate. The trigger-point check, the xmin horizon detection, the wraparound metrics, and both Realtime pages read PostgreSQL's built-in catalogs. The Avoidable-Growth / Bloat Estimate section needs pgstattuple, installed in each database you want estimated. Without it, that one section is empty and nothing else on the page changes. The Monitoring Readiness page reports whether pgstattuple is detected.
Why is autovacuum running but the table keeps growing?+
Check the root-cause card and the xmin Horizon · Holder Detail table first. If a session, replication slot, or prepared transaction is holding the horizon, autovacuum cannot remove the dead rows no matter how often it runs. If the horizon is clear, compare the table's dead tuples with its trigger point in the Full Detail table: a high per-table scale factor, or autovacuum switched off in reloptions, shows up there.
Why isn't my table listed?+
The advisor lists a table only when it has dead tuples or carries per-table storage parameters. A clean table with default settings is not listed. The bloat estimate has its own bounds: ordinary permanent tables in user schemas of at least 256 KB, in databases where pgstattuple is installed.
Will applying the recommended ALTER TABLE fix a wraparound alert?+
No. The scale-factor change affects when autovacuum fires next; it does not reduce the age a table has already accumulated. For an age alert, release any xmin holder first, then run VACUUM (FREEZE) on the table named in the alert.
Is it safe to run the suggested pg_terminate_backend or pg_drop_replication_slot?+
That depends on what the holder is, which is why the advisor shows the statement rather than running it. Terminating a backend ends that session's open transaction. Dropping a replication slot removes the position a standby or subscriber is reading from, so check whether the slot is still in use first. The Suggested Action for an active slot names its PID and says to check the standby or subscriber before dropping it.
Why does Autovacuum runs · 24h show a dash?+
The KPI is the difference between two daily snapshots of PostgreSQL's lifetime autovacuum counts, so it needs two snapshots before it can show a number. It is also read through an Enterprise Manager job, so Preferred Credentials must be set for the target.
Where this fits
The Vacuum Advisor is one of five advisors that arrived in the August 2026 release, 24.1.1.0.0 for Enterprise Manager 24ai and 13.5.15.0.0 for Enterprise Manager 13.5. The current release, 24.1.2.0.0 and 13.5.16.0.0, keeps it and adds fixes.
This is the third of four posts on those advisory features. Part one covered the Index Advisor and the HypoPG and pg_qualstats extensions behind it, and part two covered Plan Analysis and the Plan Drift Advisor. The next post covers Workload History, on replaying weeks of statement statistics from a history store that lives on the agent rather than in your Enterprise Manager repository.
- Vacuum Advisor reference → docs.integrationplumbers.io/postgresql/vacuum-advisor.html
- Installing pgstattuple → docs.integrationplumbers.io/postgresql/prerequisites.html#optional-extensions
- The plug-in → integrationplumbers.io/postgresql-plugin
See it in action
If you missed our September 23 webinar, What's New with the PostgreSQL Plug-in for Oracle Enterprise Manager, the recording walks through all five advisors running live in Enterprise Manager 24ai. The Vacuum Advisor demo starts at 16:29.
To see the plug-in in person, visit the Integration Plumbers team at Booth #7024 at Oracle AI World, October 25–28.