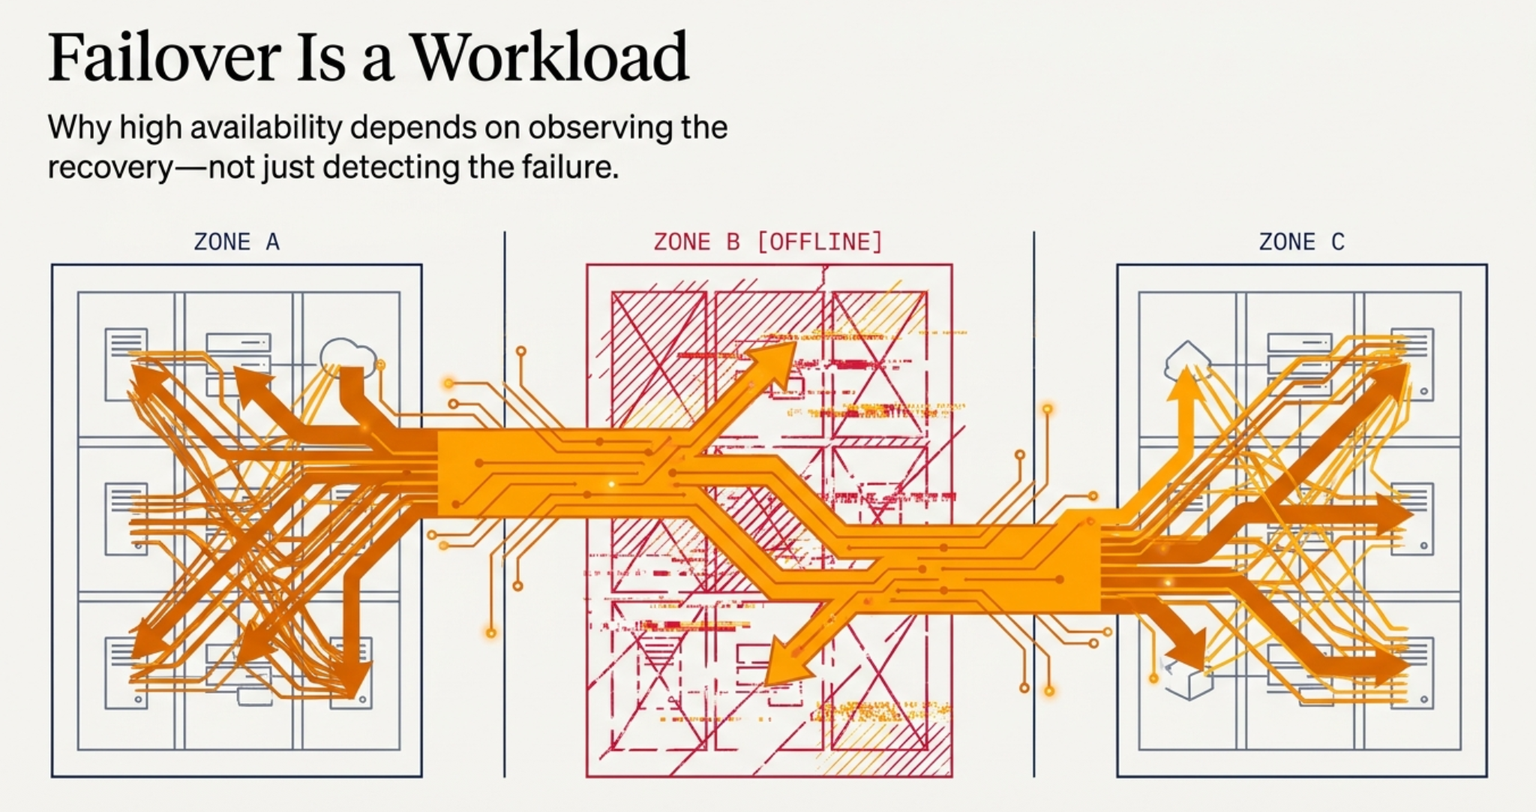
When a cloud zone fails, the obvious question is whether workloads can move somewhere else.
The harder question is what happens when they arrive.
Google Cloud's recent London-region incident puts that second question into focus. A power disruption affected one availability zone, but the consequences did not stay neatly inside that boundary. Redirected workloads strained surviving infrastructure, while dependencies on the offline zone introduced timeouts and delays elsewhere. What began as a localized infrastructure failure degraded services across the region, according to Google's incident report.
The lesson is not that redundancy is pointless or that automated failover is inherently unreliable. It is that failover changes the workload the surviving system must handle.
We should design, test, and observe it accordingly.
The failure was local. The consequences were not.
On October 20, 2026, local UK time, a data center hosting Google Cloud's europe-west2-b zone experienced a power disruption. The facility was operating in a temporary maintenance configuration when its active utility feed failed. A voltage-sensing design flaw and programmable logic controller misconfiguration prevented backup generators from starting automatically. UPS batteries sustained the load until their reserves were depleted.
The cloud-level response introduced a second set of problems.
As traffic and workloads shifted toward surviving infrastructure, Google reported that redirected queries, database failovers, and compute workloads saturated available processing capacity in other zones. Admission queues grew, some database failovers were delayed, and services returned intermittent errors. Meanwhile, cross-zone calls to metadata and catalog components in the offline zone continued to encounter timeouts.
Google identifies two primary causes of impact outside the failed zone: demand surges in neighboring zones and control-plane dependencies across zonal boundaries. The main incident window lasted six hours and eight minutes, although individual services and some remaining workloads had different recovery timelines.
That distinction matters. A zone can be physically healthy while the services running there are struggling with the consequences of another zone's failure.
Redundancy is a placement decision. Recovery is a workload problem.
An architecture diagram can show multiple replicas across multiple zones. It cannot, by itself, demonstrate that the remaining infrastructure can absorb a sudden change in demand.
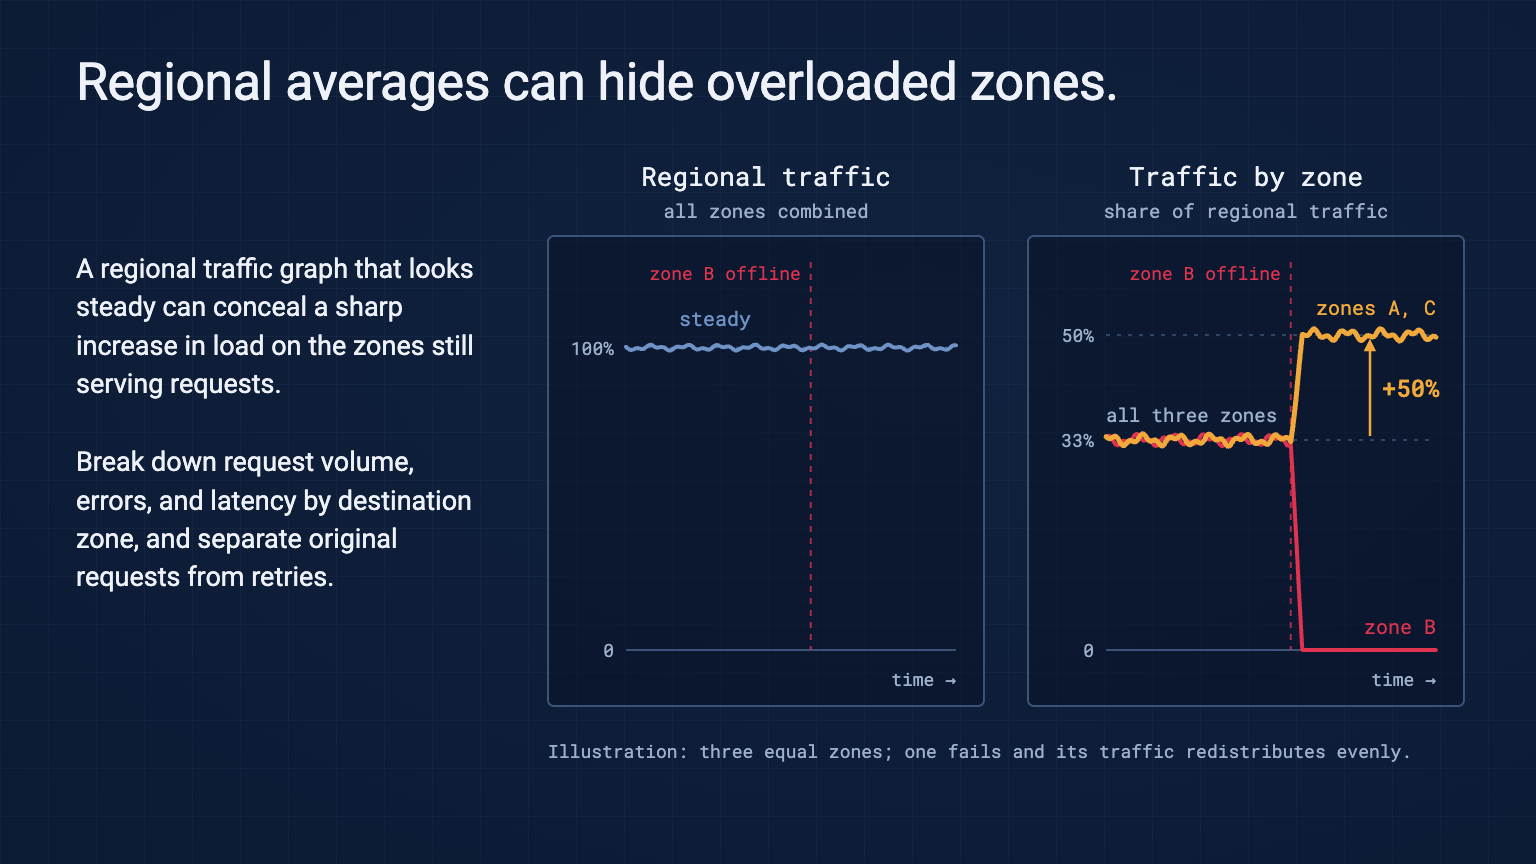
Consider a simplified example: three equally sized zones, each handling one-third of a service's traffic. Lose one zone and redistribute its traffic evenly, and each surviving zone must handle 50% more traffic than before.
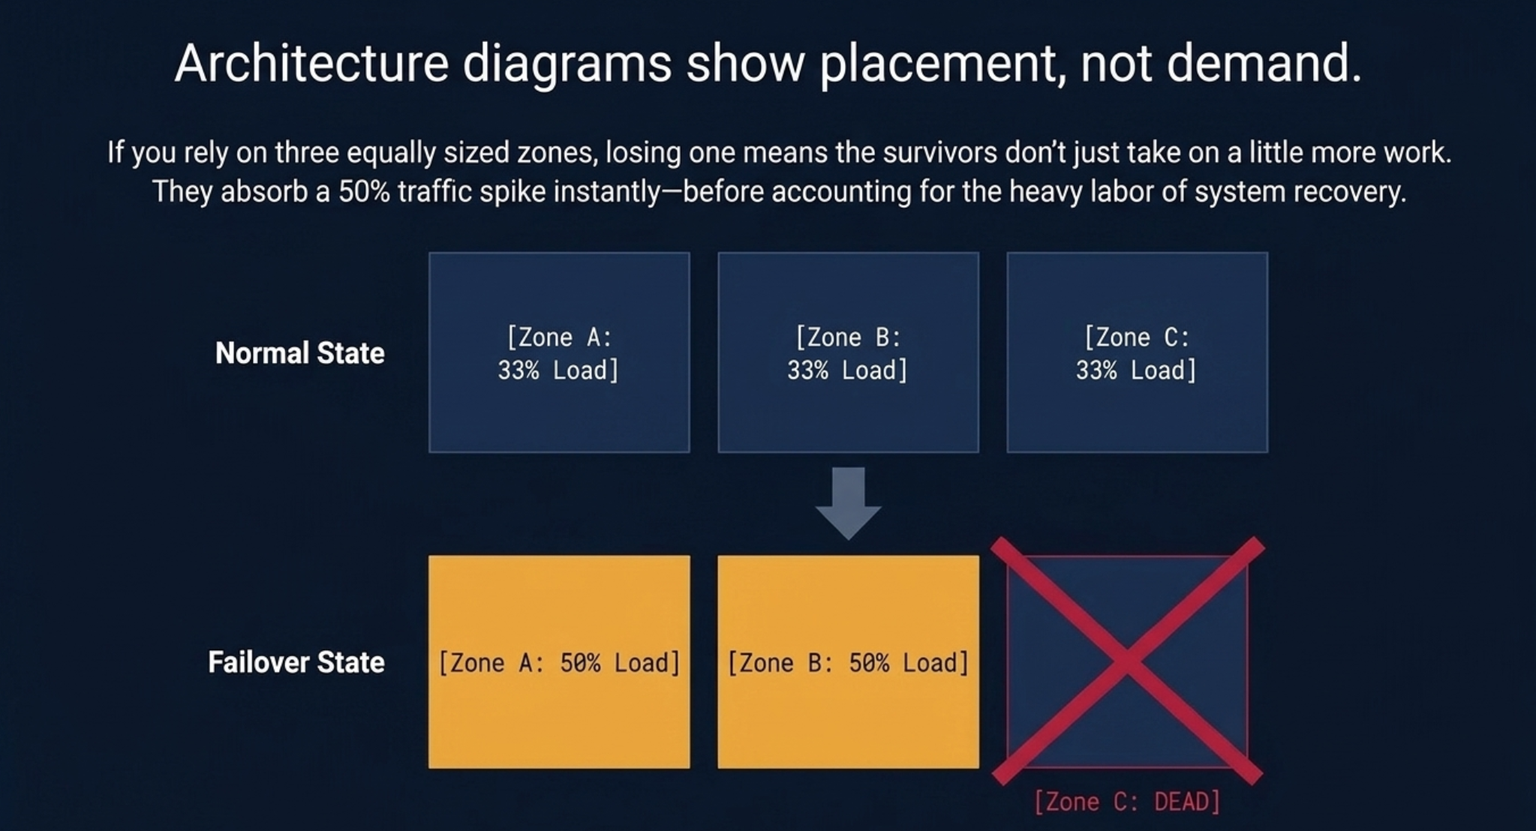
That is before accounting for recovery work.
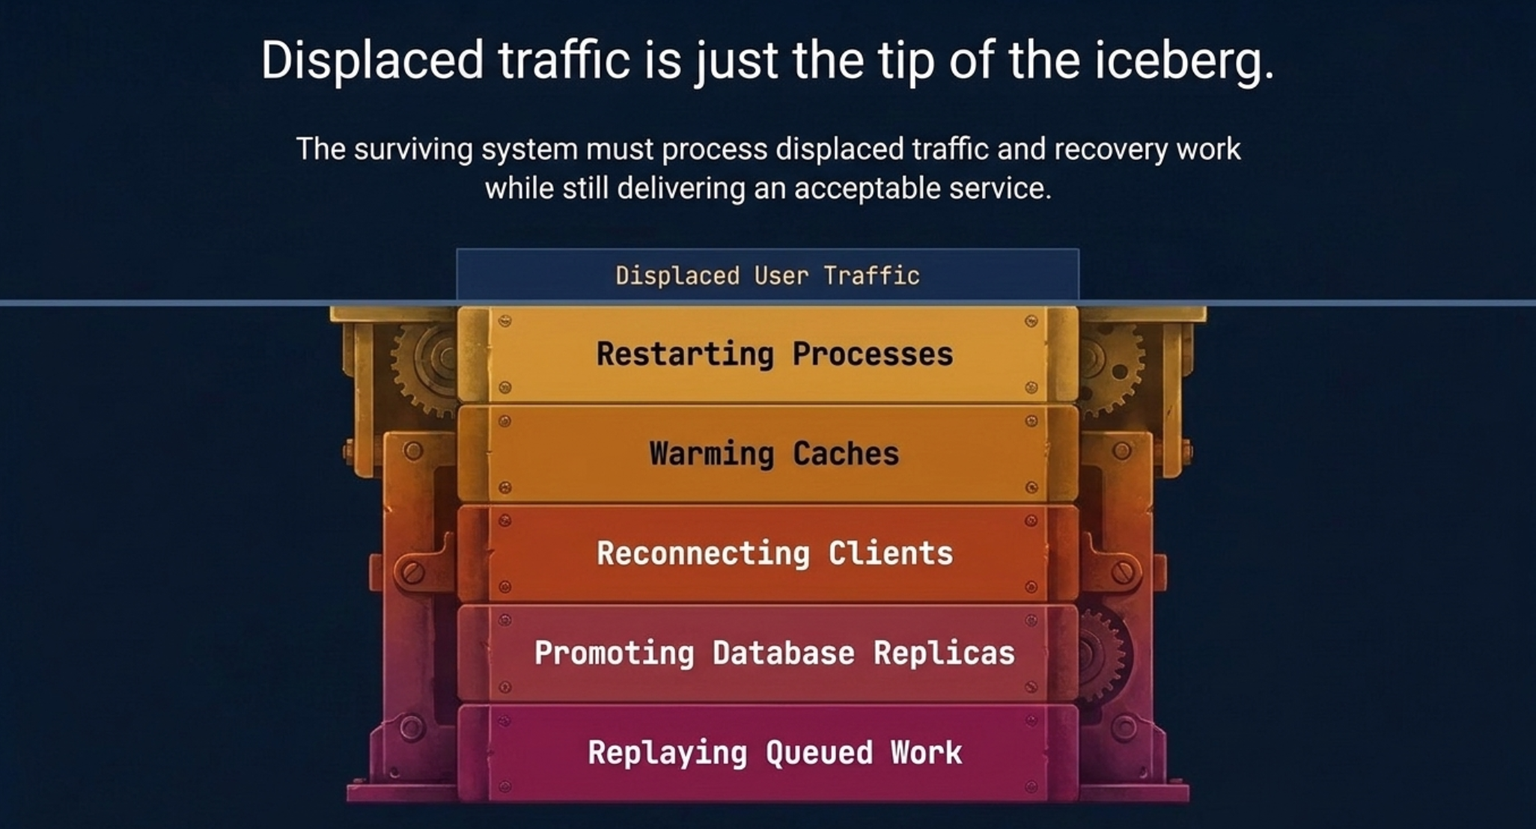
Depending on the system, recovery may also involve restarting processes, warming caches, reconnecting clients, promoting database replicas, and replaying queued work.
Retries can add further demand precisely when capacity is constrained. Google's SRE guidance on cascading failures describes how retries and redistributed traffic can create a feedback loop: overloaded replicas fail, their traffic moves elsewhere, and the remaining replicas become overloaded in turn.
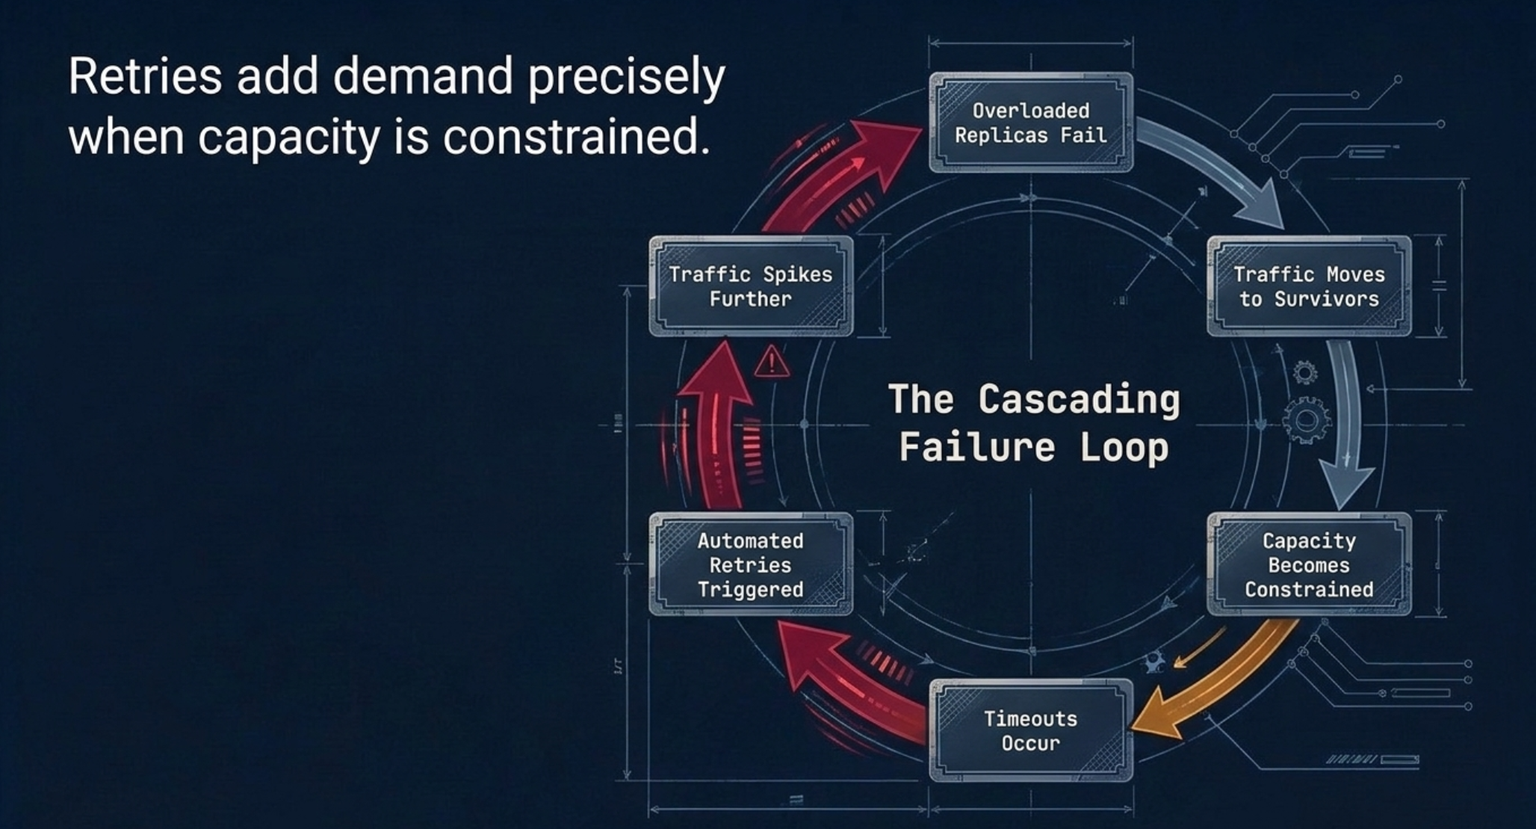
Failover is a workload—not just a routing change.
The useful planning question is therefore not simply, "Do we have another zone?"
It is, "Can the surviving system process displaced traffic and recovery work while still delivering an acceptable service?"
Observability must follow the displaced work
Detecting the initial failure is necessary. It is not enough to manage the recovery.
During the London incident, automated monitoring detected elevated API error ratios, job-submission timeouts, and loss of infrastructure reachability. But mitigation also required isolating the failed zone, changing resource allocations, relieving contention, and eventually reintroducing traffic in a controlled way.
This is where observability becomes operationally useful. Metrics, logs, and traces provide different views of system behavior; together, they can help responders move from "something failed" to "this is where work is accumulating, and this is the dependency preventing progress." Google's monitoring guidance specifically recommends visibility into resource consumption and dependency latency, response codes, and request sizes.
For failover, I would organize that visibility around four questions.
1. Where did the traffic go?
A regional average is not enough. The important question is whether the surviving locations are receiving a manageable share of displaced demand.
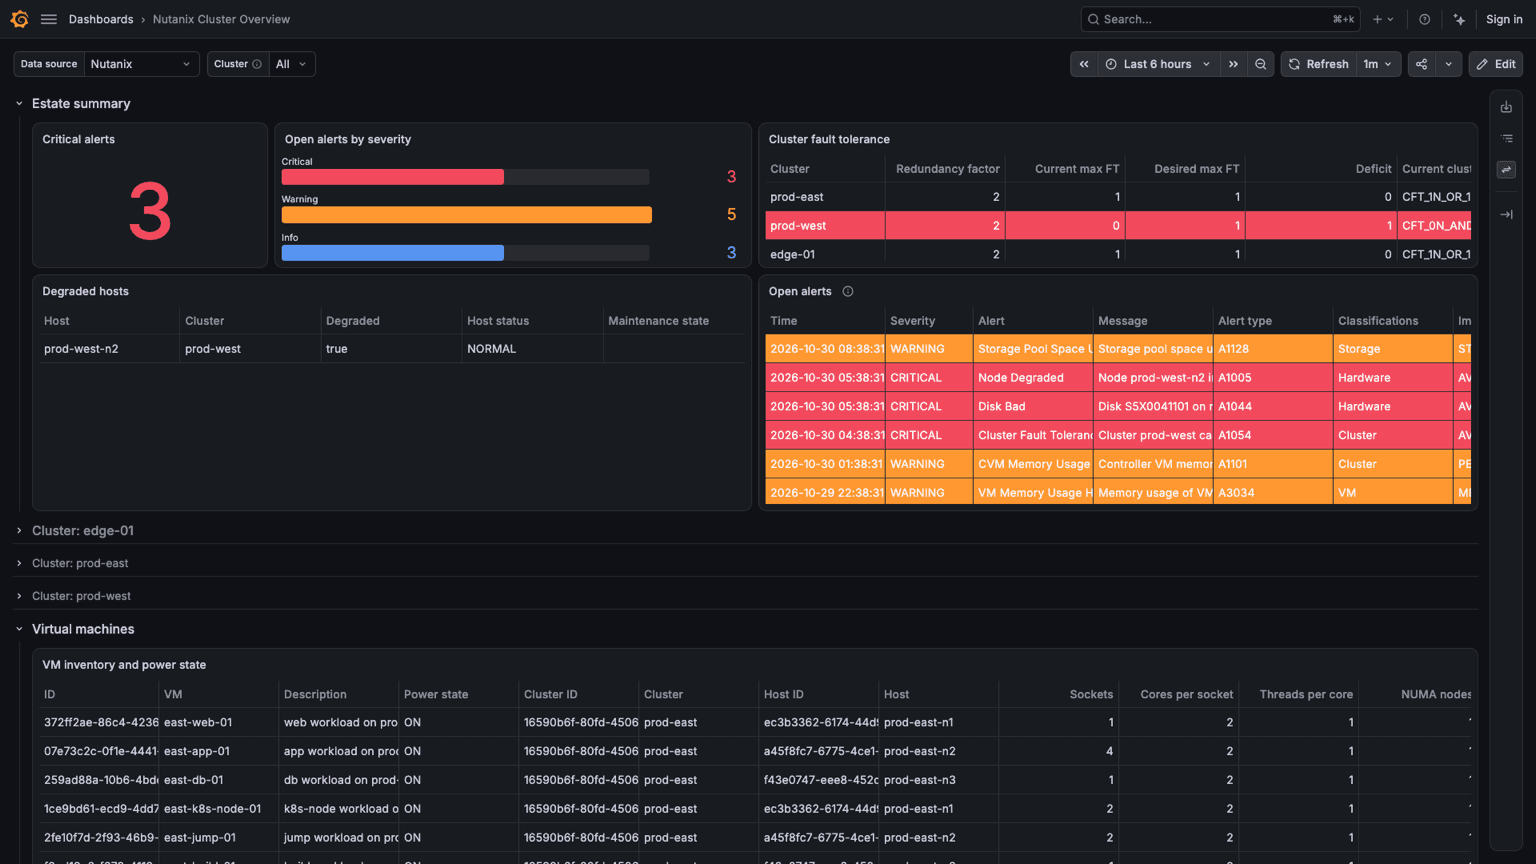
A practical failover view should break down request volume, errors, and latency by service and destination zone or region. Where feasible, it should distinguish original requests from retries and show changes in routing alongside changes in traffic.
The objective is to make redistribution visible. A global traffic graph that looks steady can conceal a dramatic increase in load on the infrastructure still serving requests.
2. Is the system completing useful work?
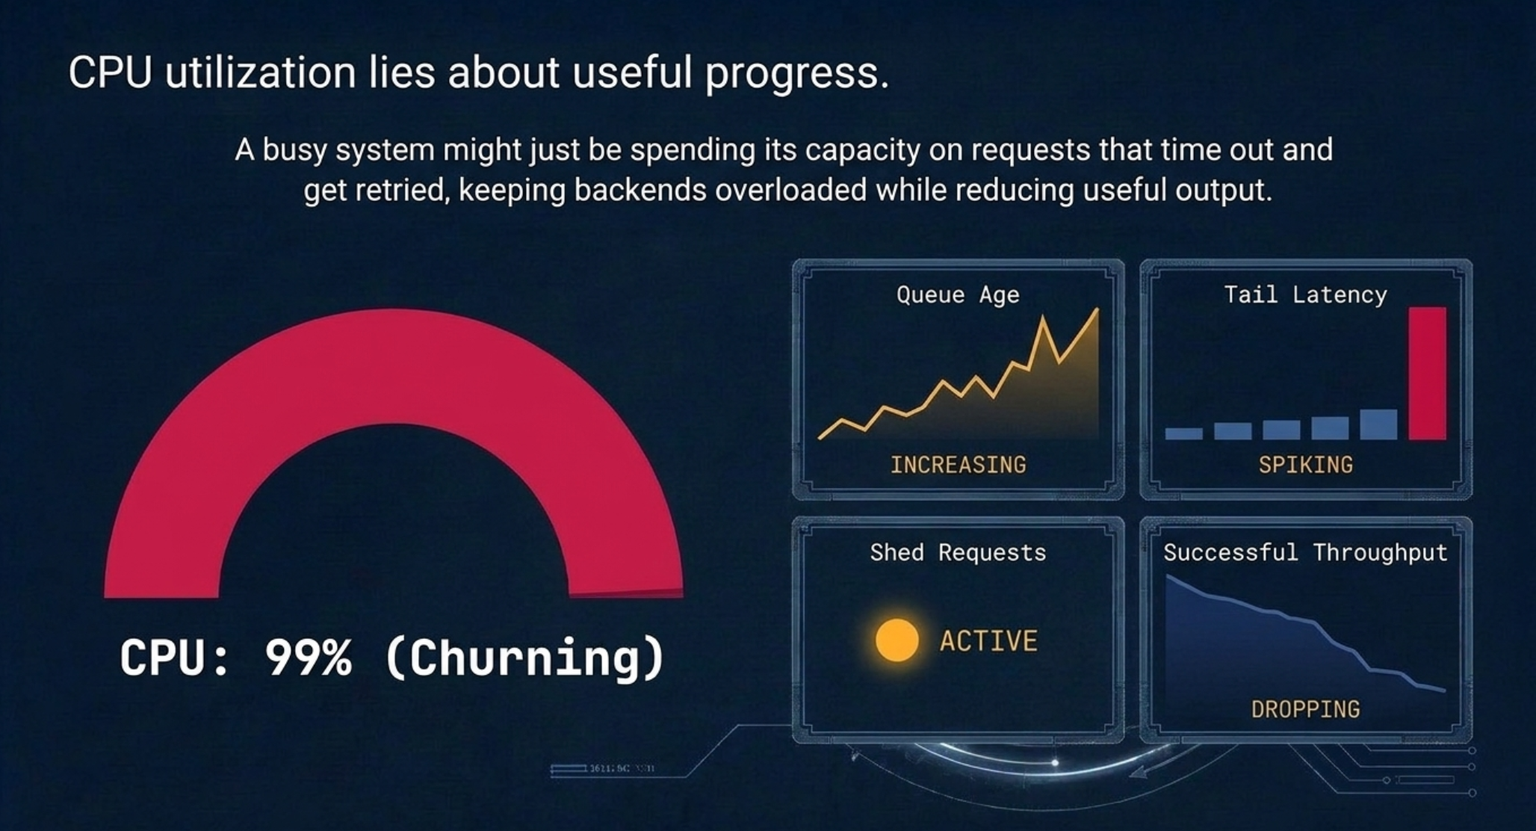
CPU utilization alone does not tell us whether recovery is succeeding.
A busy system may be completing customer transactions. It may also be spending its capacity on requests that time out and get retried. Google's cascading-failure guidance warns that retrying unsuccessful work can keep a backend overloaded while reducing the proportion of useful work it performs.
For a failover dashboard, I would pair successful throughput with:
- Queue depth and the age of the oldest queued work.
- End-to-end latency, including tail latency.
- Timeout and retry rates.
- Connection-pool, worker-pool, or execution-slot saturation.
- Rejected or deliberately shed requests.
Those measurements help answer a more useful question than "Are the servers busy?": "Are we making progress?"
3. Which dependencies still reach into the failed location?
The London incident demonstrates why location-aware dependency visibility matters. Some regional control-plane calls continued reaching metadata and catalog components in the offline zone, producing timeouts and submission stalls.
For application teams, this is a reason to retain deployment-location context in telemetry and examine dependency paths, not just individual service health. A proposed investigation workflow might start with a slow customer transaction, follow its downstream calls, and then correlate those calls with routing changes, failover events, and deployment locations.
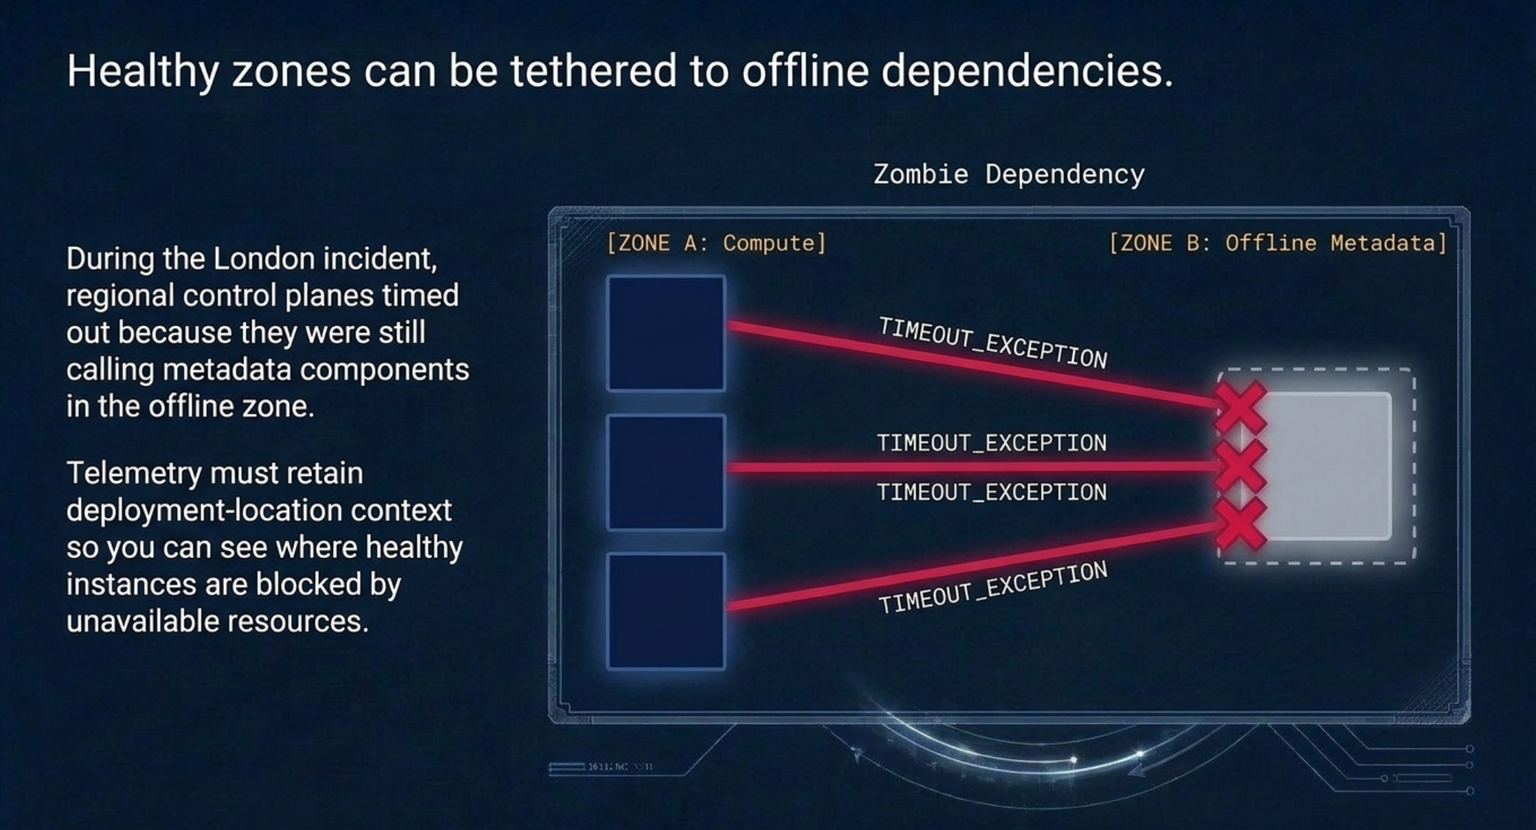
The question is not just whether a service has healthy instances. It is whether those instances still need something that is unavailable.
4. Is recovery itself creating the next bottleneck?
Restoring infrastructure and restoring service are different milestones.
Google restored power before all workloads could safely return. Storage devices required recovery after unclean shutdowns, and responders deliberately avoided restoring services that could make the situation worse. Traffic was later readmitted gradually after health and storage-integrity checks.
A recovery view should therefore show more than an increasing count of healthy instances. I would also track readiness to serve traffic, backlog-drain rates, dependency health, and the customer-facing results of each increase in admitted load.
"Back online" is a state. "Safely carrying production traffic" is an outcome.
Turn telemetry into recovery decisions
Observability does not create spare capacity or fix a broken dependency. It supplies evidence for deciding what to do next.
That distinction is important: a dashboard is not a recovery mechanism. Its value depends on whether responders—or carefully bounded automation—can connect its signals to useful actions.
A practical runbook could make those connections explicit:
| Observed condition | Decision it should inform |
|---|---|
| Retry traffic rises while successful throughput falls | Reduce retry amplification; enforce retry limits and backoff. |
| Queue age grows and execution capacity is saturated | Defer lower-priority work or apply admission control. |
| Requests continue timing out against unavailable endpoints | Verify routing isolation and dependency failover. |
| Newly restored capacity struggles as traffic returns | Slow readmission and allow the system to stabilize. |
These are general recovery patterns, not a reconstruction of every action taken during the London incident. Google's SRE guidance supports bounded retries, randomized exponential backoff, load shedding, and gradual increases in traffic as defenses against cascading failure.
The London report provides concrete examples of the same operational principle: responders adjusted routing, reprioritized workloads, changed resource safeguards, and controlled traffic readmission rather than simply waiting for machines to restart.
The goal is not to automate every response. It is to avoid discovering, during an outage, that the team can see the problem but has no agreed way to act on it.
Test the recovery, not just the switch
Google's SRE guidance recommends testing capacity limits and overload behavior, including how systems behave during large restarts. That is a broader exercise than verifying that traffic can move from one location to another.
For the next failover exercise, I would define success through questions such as:
- How much additional demand can surviving locations accept?
- How long does displaced work wait before it is processed?
- Do retries remain bounded?
- Can responders identify the limiting dependency?
- Can lower-priority work be paused without stopping critical transactions?
- Can traffic return gradually without triggering another overload?
The observability requirements should be part of the test's acceptance criteria. If the team cannot explain why recovery slowed down, the exercise has exposed a visibility gap—even if the service eventually recovered.
Availability is demonstrated during the transition
The London incident is a reminder that the boundary of the original failure and the boundary of customer impact are not necessarily the same. Capacity constraints and cross-zone dependencies helped extend the consequences beyond the zone that lost power.
That is why high availability needs more than redundant placement and a working failover trigger. It needs a recovery process whose behavior can be understood under stress.
Observability makes that process visible: where the work moved, whether useful throughput is recovering, which dependencies are blocking progress, and when it is safe to admit more load. Coupled with tested controls, that evidence helps turn recovery from an opaque chain reaction into a managed operation.
The next time we review an HA design, the first question can still be, "Where does the workload go when this fails?"
The second should be, "How will we know the destination can handle it?"
What happened in Google Cloud's europe-west2 incident?+
On October 20, 2026 (UK time), a data center hosting the europe-west2-b zone lost power while operating in a temporary maintenance configuration, and its backup generators did not start automatically. Automated failover shifted queries, database failovers, and compute workloads to the neighboring zones, which saturated their capacity, and calls to metadata and catalog components in the offline zone kept timing out. Google puts the incident window at six hours and eight minutes.
Why does losing one zone of three mean 50% more load on the others?+
If each of three equal zones carries one-third of the traffic and one fails, its third is split between the two survivors. Each goes from one-third to one-half of the total, which is a 50% increase on what it carried before. Recovery work and retries come on top of that.
What should a failover dashboard show?+
Request volume, errors, and latency broken down by service and destination zone; original requests separated from retries; successful throughput alongside queue age, tail latency, timeout and retry rates, and pool saturation; dependency calls tagged with the location they reach; and, during recovery, readiness to serve traffic and backlog-drain rates as load is readmitted.
How should a failover test be judged?+
By more than whether traffic moved. Useful acceptance criteria include how much extra demand the surviving locations accept, how long displaced work waits, whether retries stay bounded, whether responders can name the limiting dependency, and whether traffic can return gradually without causing another overload.