Part 2 of 2. Part 1 covered why traditional log pipelines break and how Loki's native OTLP endpoint reframes the problem.
There is a specific kind of dread that comes with rolling out a new log pipeline. Not the design work, which is the interesting part, but the week afterward, when a team you have never met opens a ticket saying their logs stopped showing up, and you have no idea whether the problem is their instrumentation, your processors, or a Loki limit nobody documented. Most of us have run that week at least once, and it is the reason good pipelines get postponed in favor of the bad one that already works.
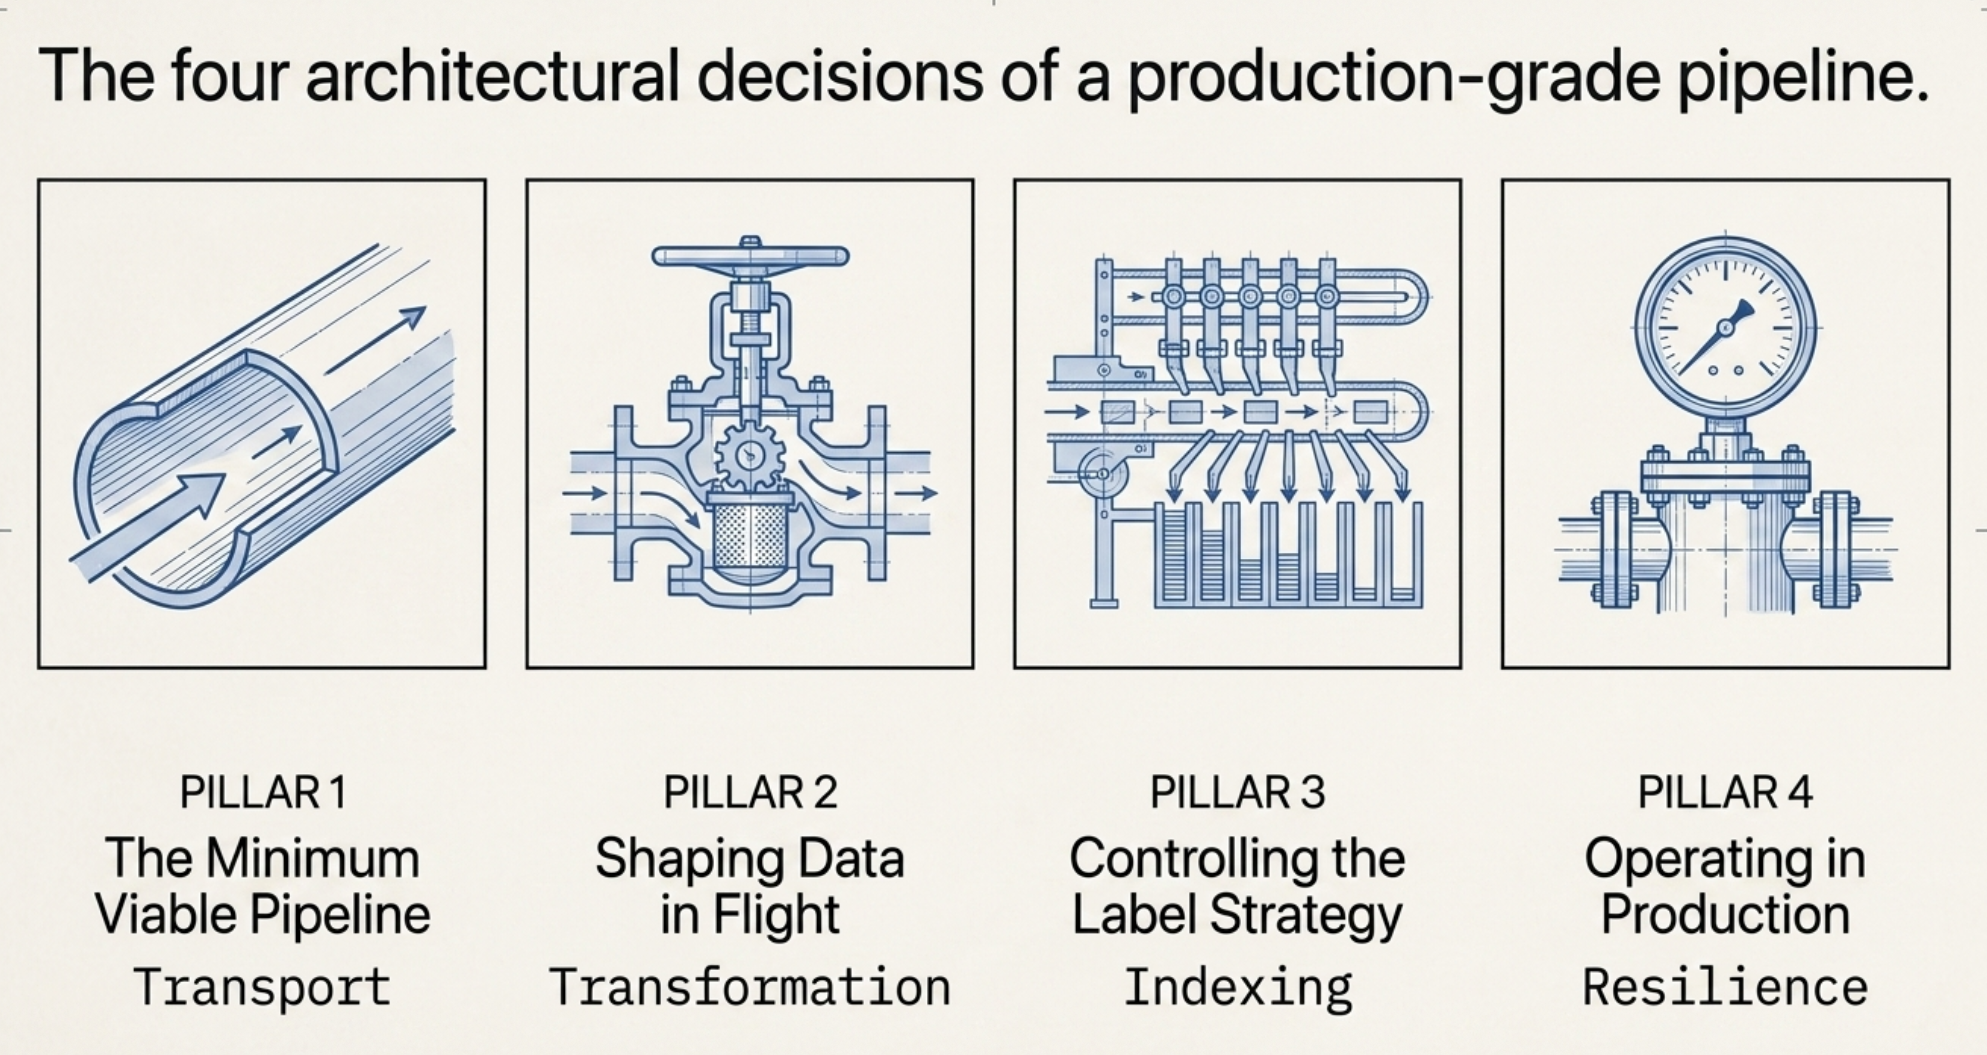
The bottom line for this half: a production-grade Alloy and Loki pipeline is four decisions, not four hundred lines of config. You decide what gets in, what gets rewritten, what gets indexed, and what happens when the backend is unavailable. Build those four deliberately and the pipeline stays boring, which is the highest compliment observability infrastructure can receive.
This post covers four sections, in order: the minimum viable pipeline, shaping data in flight, controlling what becomes a label, and operating it in production. Code throughout is illustrative rather than a drop-in file; the goal is that you can recognize each piece when you write your own.
1. The minimum viable pipeline
Start here and resist the urge to add anything until it works end to end.
otelcol.receiver.otlp "default" {
  http {}
  grpc {}
  output {
    logs = [otelcol.processor.batch.default.input]
  }
}

otelcol.processor.batch "default" {
  output {
    logs = [otelcol.exporter.otlphttp.default.input]
  }
}

otelcol.exporter.otlphttp "default" {
  client {
    endpoint = "http://loki:3100/otlp"
  }
}
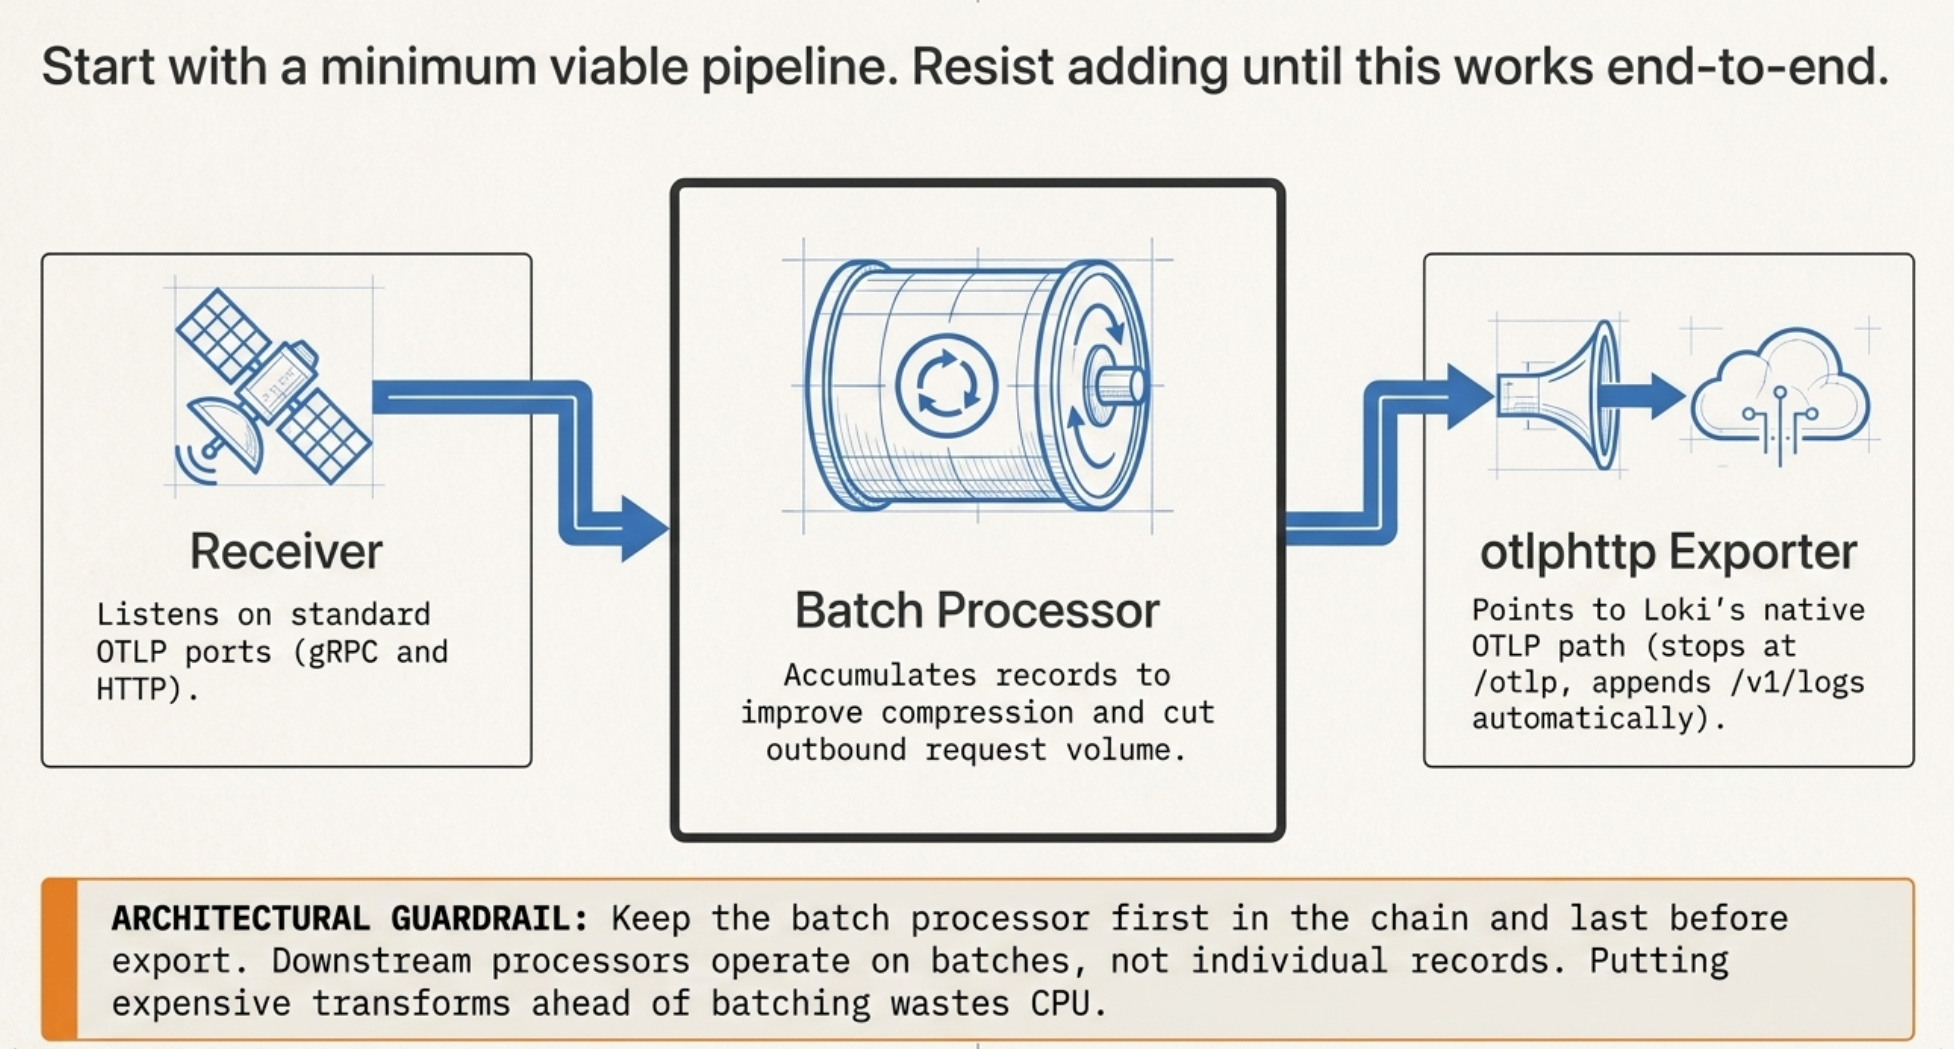
Three components, and Grafana's own worked example follows the same shape. The receiver listens on the standard OTLP ports for both gRPC and HTTP. The batch processor accumulates records before export, which improves compression ratios and cuts the number of outbound requests: on a busy node this is the difference between thousands of small HTTP requests per minute and dozens of large ones. The otlphttp exporter points at Loki's native OTLP path; it appends /v1/logs for you, so the endpoint stops at /otlp.
Two things to get right immediately.
Keep the batch processor first in the chain and last before export. Every processor downstream of it operates on batches rather than individual records, which is where the CPU savings come from. Putting expensive transforms ahead of batching means paying per-record overhead you did not need to pay.
Reload rather than restart. Alloy exposes a reload endpoint:
curl -X POST http://localhost:12345/-/reloadA restart drops whatever is in the export queue. During a change window that is a small, self-inflicted gap in exactly the data you would want if the change went badly.
Confirm this much works, a log record in one end and a line visible in Grafana Explore at the other, before continuing. Every subsequent section is easier to debug when you know the transport is sound.
2. Shaping data in flight
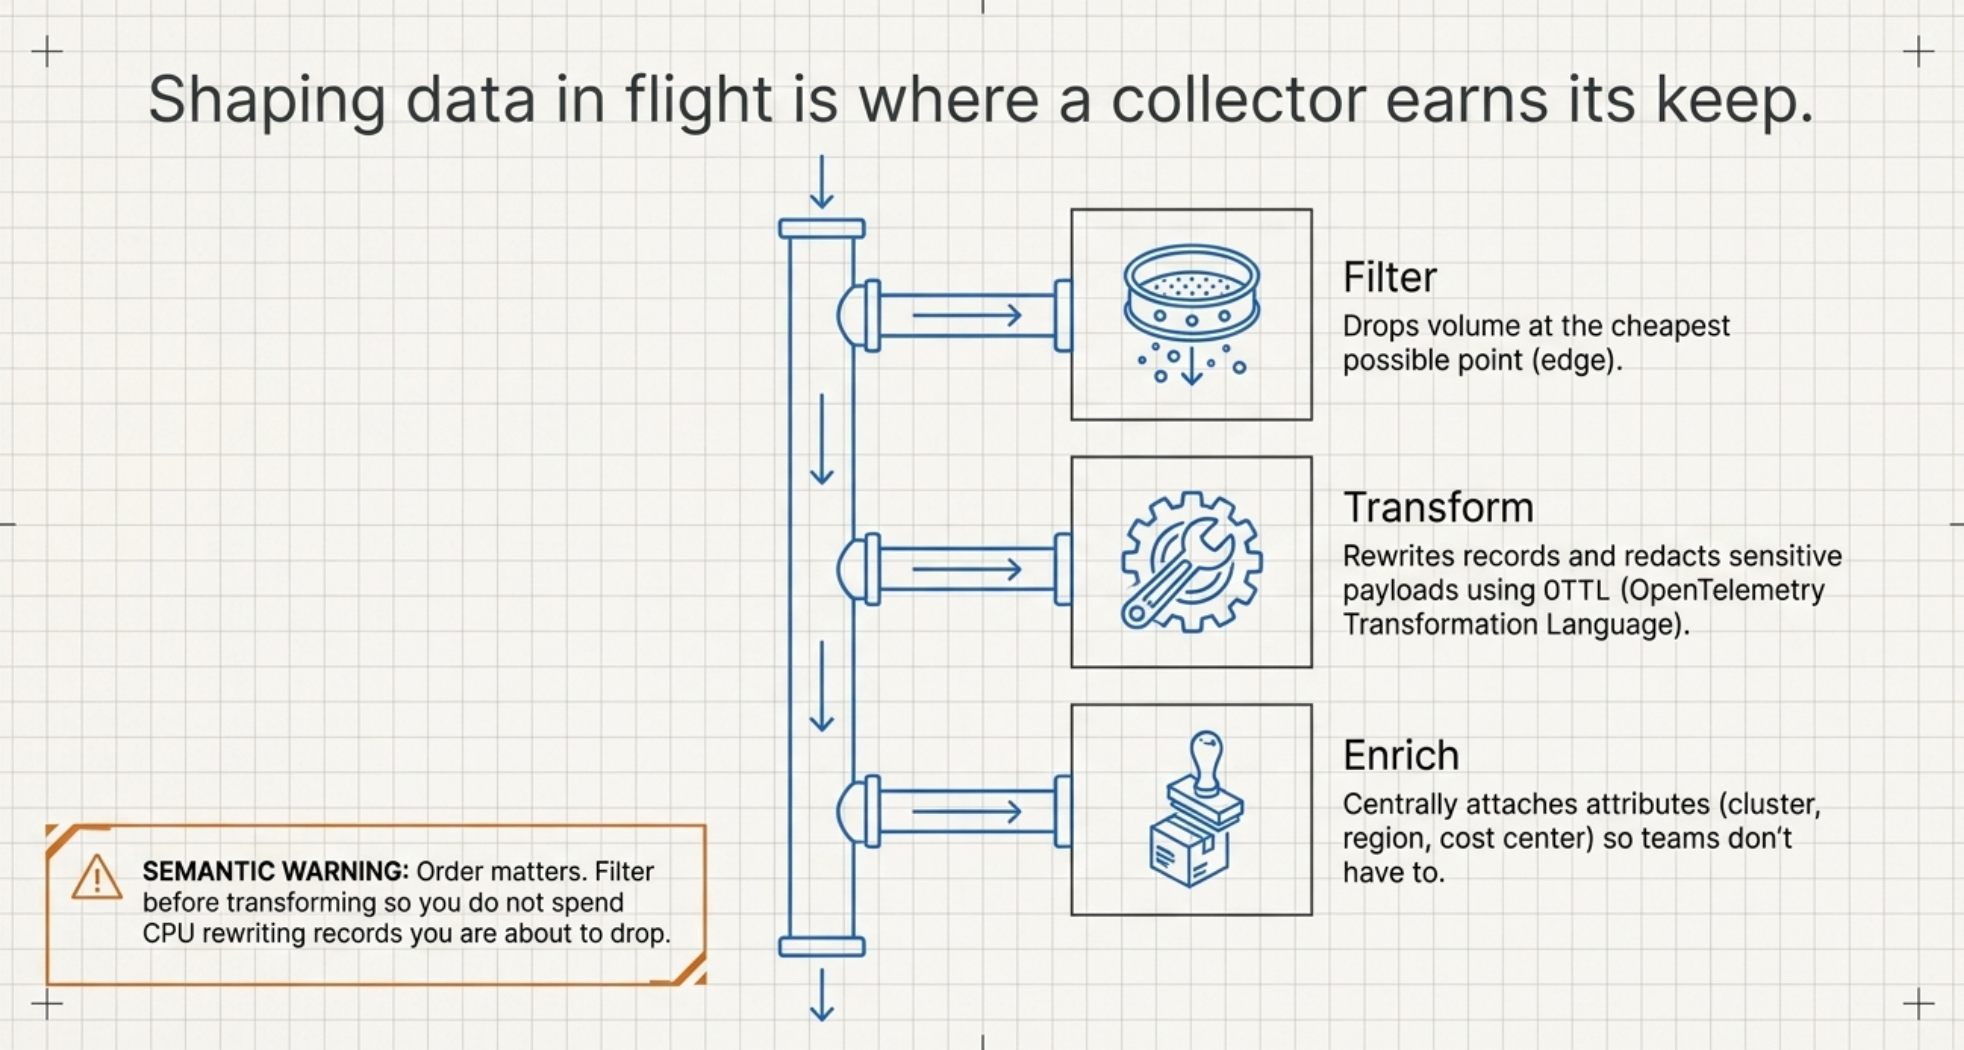
This is where a collector earns its keep. Three processors cover the overwhelming majority of real needs.
Filtering removes volume at the cheapest possible point. Health checks, readiness probes, and load balancer pings are high-frequency, low-value traffic. Measure your own share before quoting a number, but in most Kubernetes estates it is a large enough slice to fund the migration on its own. otelcol.processor.filter drops them with an OTTL condition, before the bytes are compressed, transmitted, ingested, indexed, or stored. Dropping at the edge beats dropping anywhere else by a wide margin.
Transforming rewrites records using OTTL, scoped to a resource, scope, or log context:
otelcol.processor.transform "default" {
  error_mode = "ignore"

  log_statements {
    context = "log"
    statements = [
      `set(attributes["body"], body)`,
    ]
  }

  output {
    logs = [otelcol.exporter.otlphttp.default.input]
  }
}
The error_mode argument matters more than it looks. ignore skips a failing statement and continues; propagate surfaces the error and can fail the batch. For a shared pipeline serving teams whose log shapes you do not control, ignore is usually correct: one team emitting an unexpected type should not stall everyone else's telemetry.
Transform is also where redaction happens: match a token or account-number pattern in the body and replace it before export. Doing this in the collector rather than in application code means one implementation to audit instead of one per service, and it means the sensitive value never reaches durable storage, which is a materially different compliance posture than deleting it later.
Enriching attaches attributes centrally, including cluster name, region, environment, and cost center, instead of relying on every team to set them consistently. This is the difference between "can you break down log spend by team?" being a five-minute query and being a quarter-long project.
Two cautions, both learned expensively:
- OTTL runs on every record. Regex-heavy statements applied to high-volume streams will show up in Alloy's CPU profile. Scope them with
conditionsso they only evaluate where they are needed. - Order is semantic. Filter before transform, so you do not spend CPU rewriting records you are about to drop.
3. Controlling what becomes a label
Part 1 argued this is the highest-leverage decision in the pipeline. Here is the mechanism.
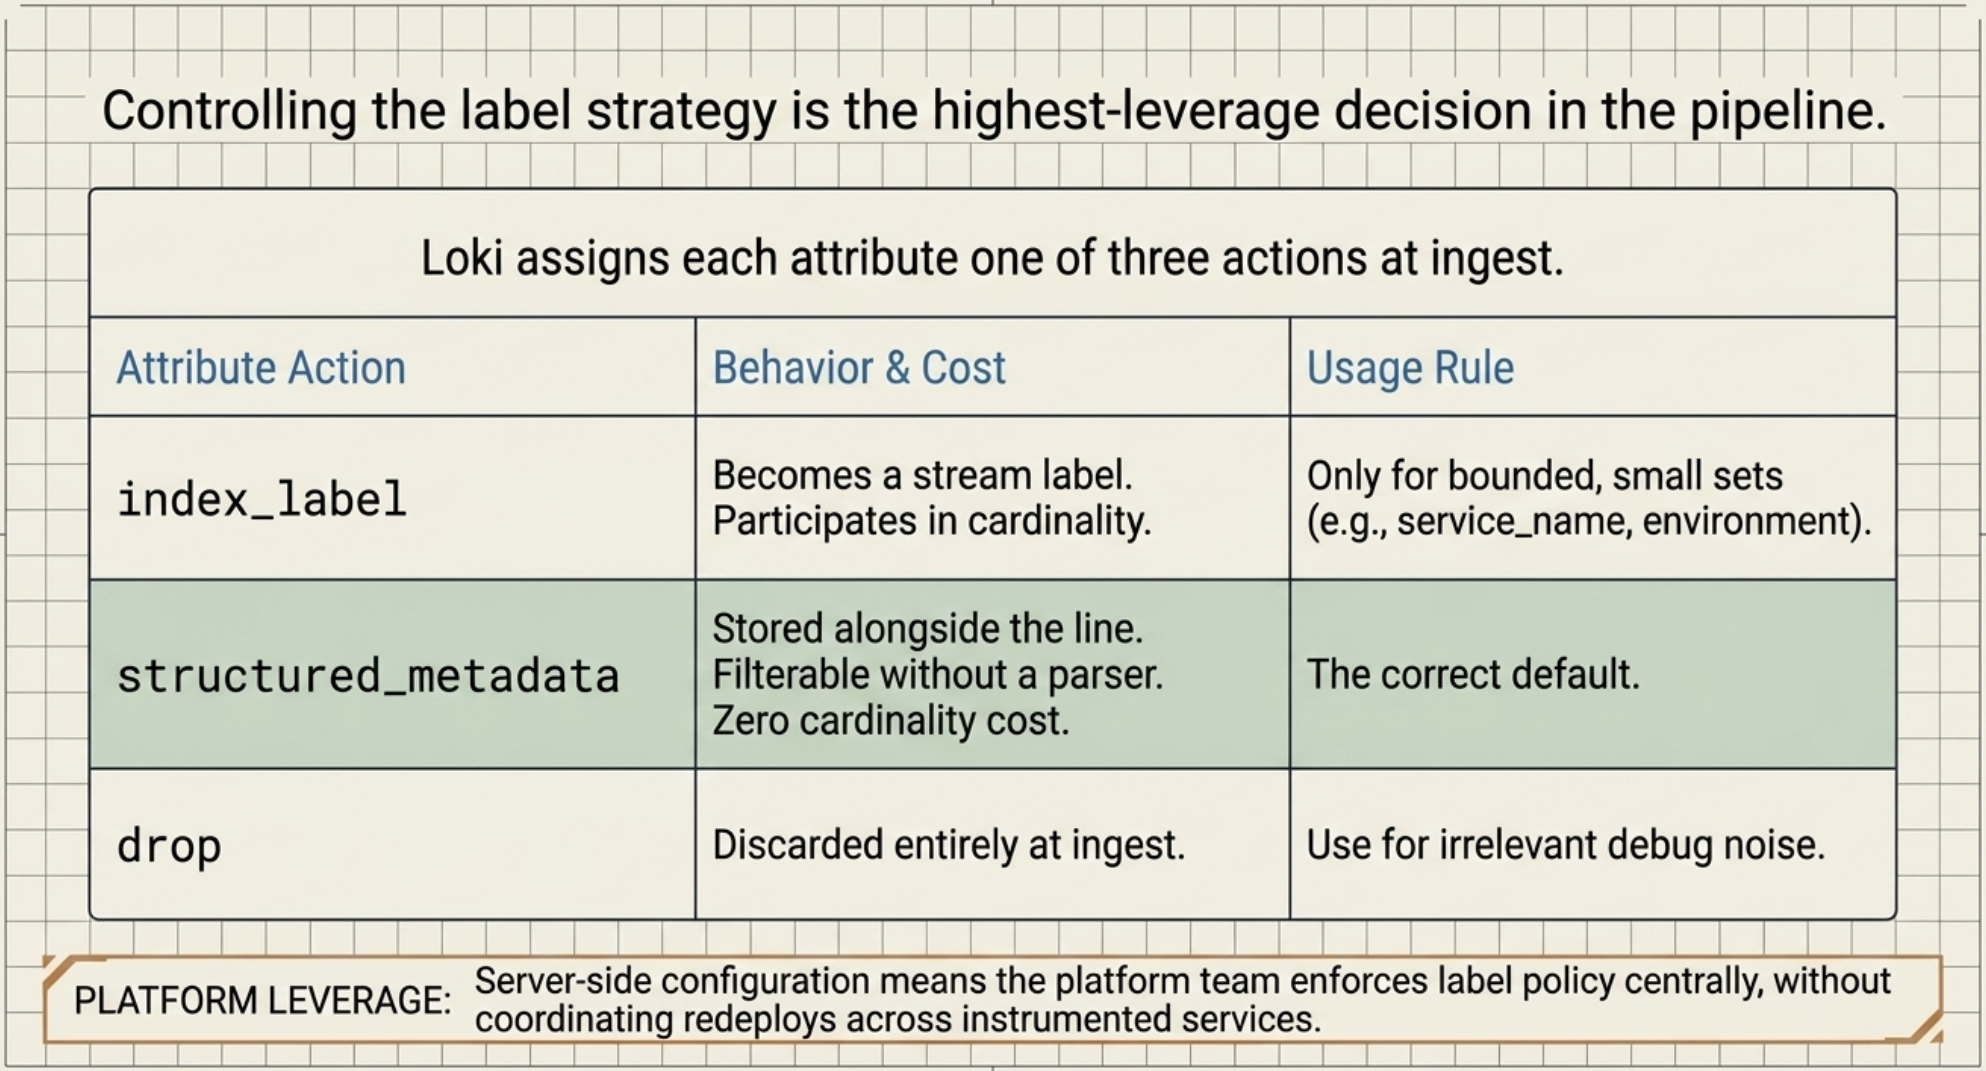
Loki's limits_config.otlp_config assigns each attribute one of three actions:
index_label: becomes a stream label, participates in cardinality, usable in{}selectorsstructured_metadata: stored alongside the line, filterable without a parser, no cardinality costdrop: discarded at ingest
Anything you do not explicitly place lands in structured metadata by default, which is the correct default and worth leaning on.
A workable rule of thumb: an attribute earns index_label status only if you would put it in a {} selector to narrow a search, and it has a bounded, small set of values. service_name, service_namespace, deployment_environment_name, and cluster almost always qualify. pod, instance_id, request_id, user_id, and trace_id almost never do, and they do not need to, because structured metadata makes them filterable anyway.
Recall from Part 1 that Loki's defaults still promote k8s.pod.name and service.instance.id for backward compatibility, and that Grafana's own docs now advise against both. On an autoscaled cluster these are unbounded in practice. Every rollout mints a new set of streams, each with its own index entry and its own partially-filled chunks holding ingester memory. Moving them to structured_metadata is frequently the single largest efficiency win available, and it costs you nothing at query time:
{service_name="checkout"} | pod="checkout-7d9f-x2k4"Still works. Still fast. No index entry.
The reason to make this call in Loki rather than in Alloy is enforcement. Server-side, per-tenant configuration means the platform team owns label policy and can change it without coordinating a redeploy across every instrumented service. That is what makes it a policy instead of a suggestion.
4. Operating it in production
Four things to get right before you consider this done.
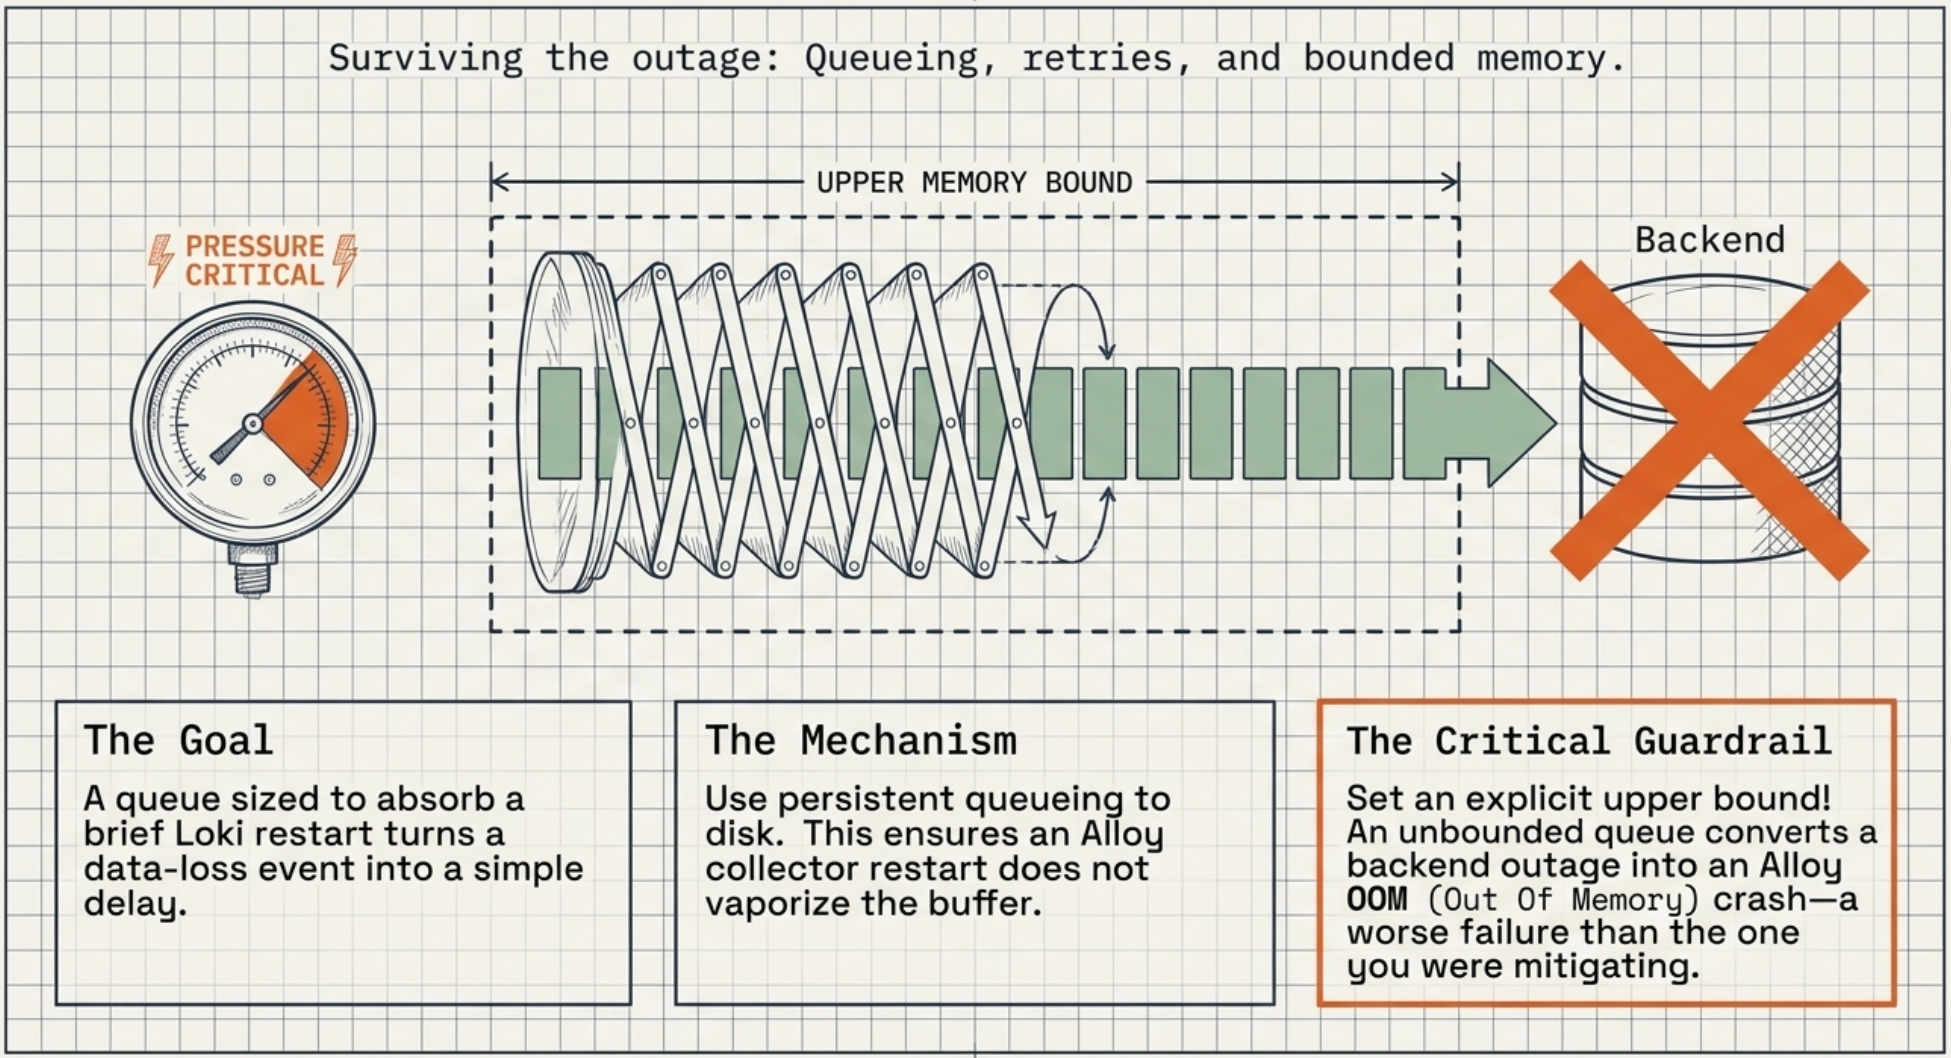
Queueing and retry. Configure the exporter's sending queue and retry behavior explicitly. The scenario that matters is a Loki restart during an incident, precisely when the logs are most valuable. A queue sized to absorb a few minutes of outage turns a data-loss event into a brief delay. Persistent queueing writes to disk so a collector restart does not vaporize the buffer. Set an upper bound: an unbounded queue converts a backend outage into an Alloy OOM, which is a worse failure than the one you were mitigating.
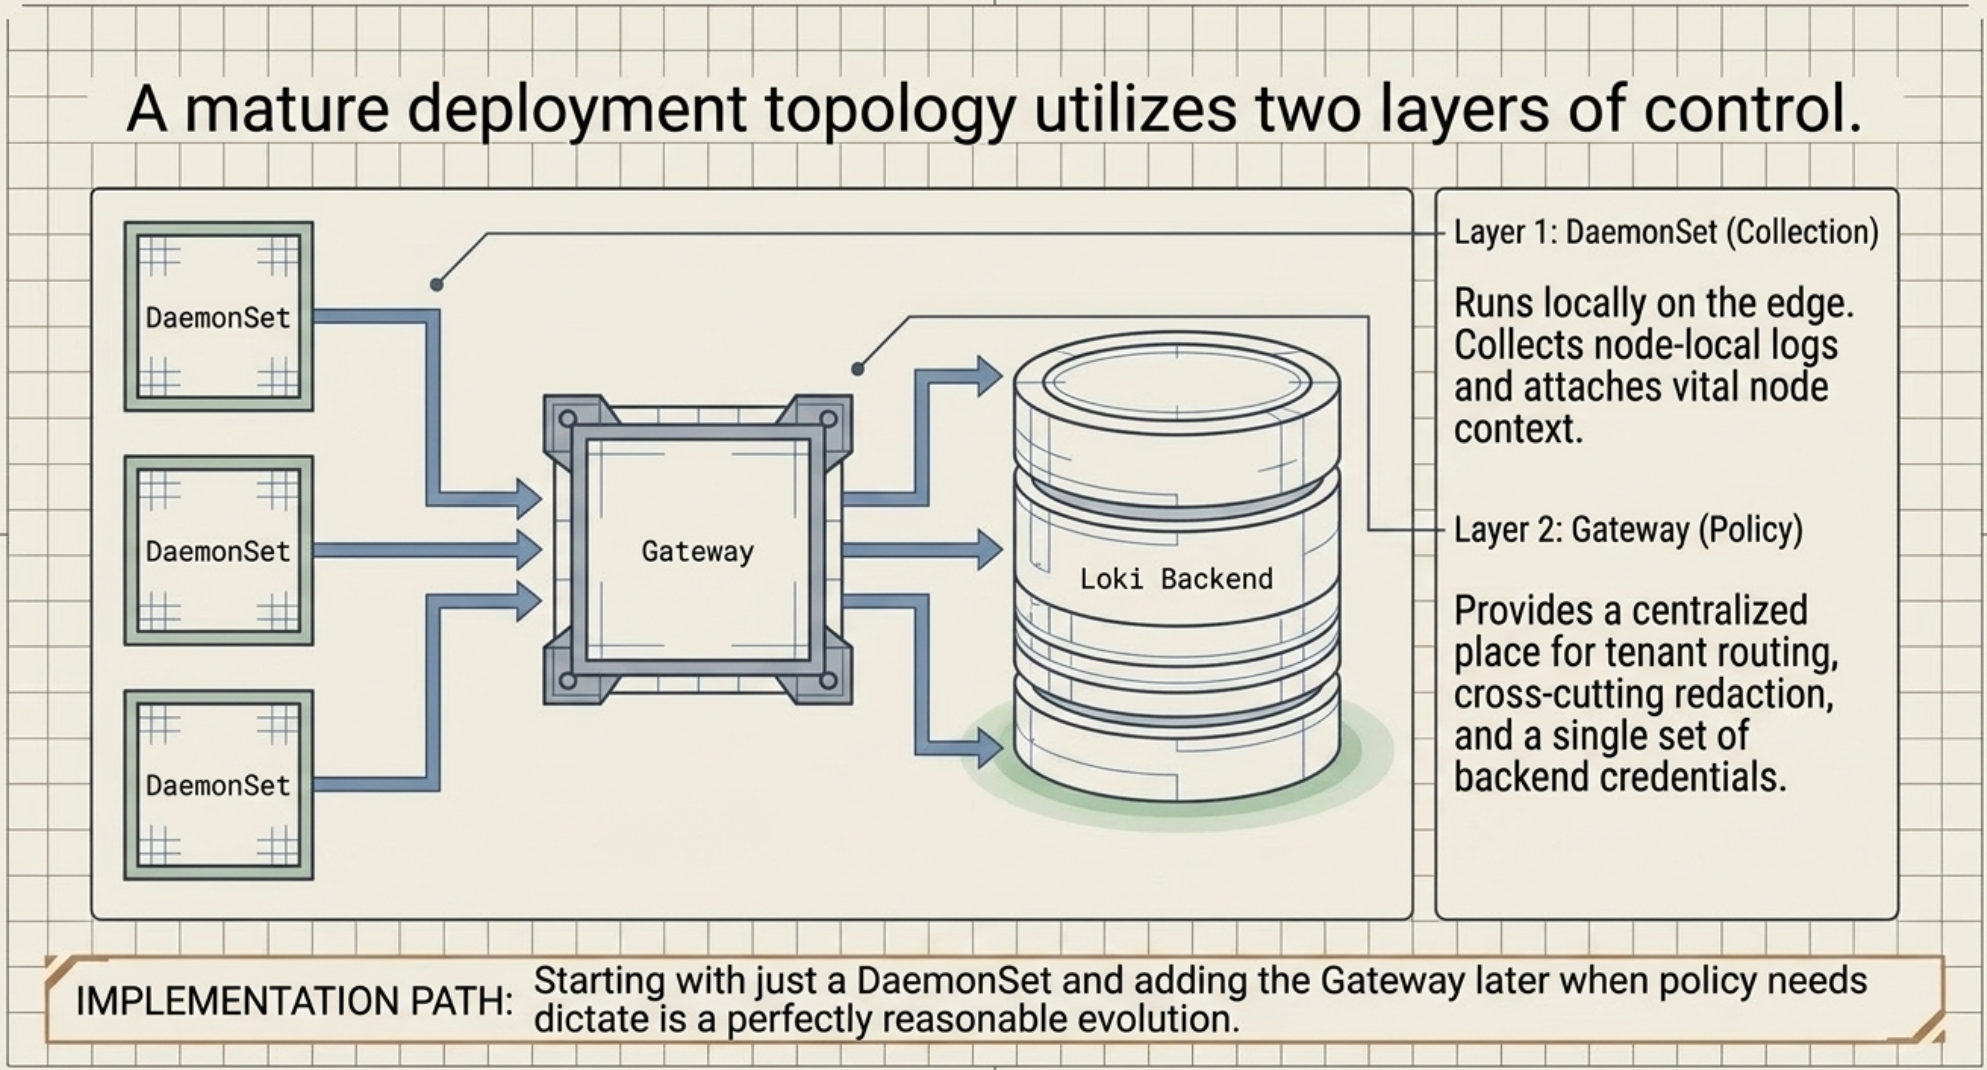
Deployment topology. A DaemonSet collects node-local logs and adds node context. A gateway deployment gives you a central place for tenant routing, cross-cutting redaction, and a single set of credentials. Most mature setups run both, a DaemonSet for collection and a gateway for policy, but starting with a DaemonSet and adding the gateway when you need it is a perfectly reasonable path.
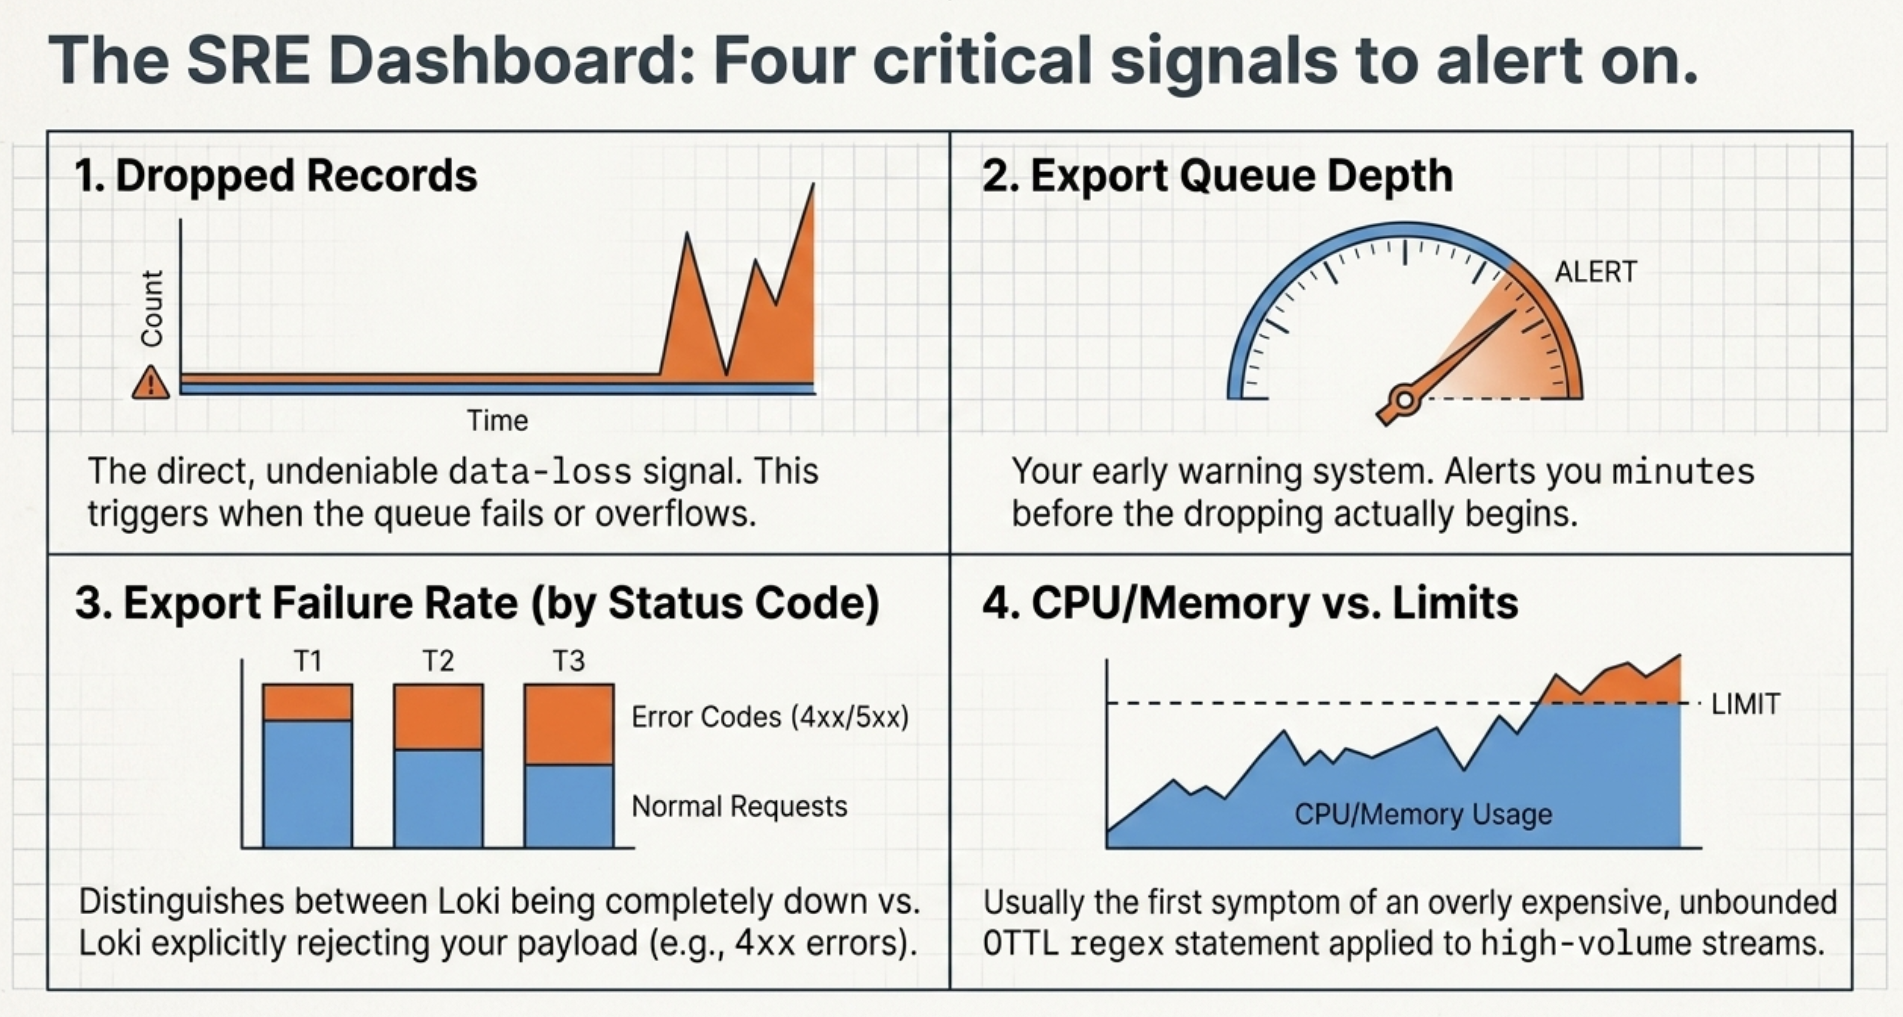
Signals to watch. Alloy exposes its own metrics; four are worth alerting on:
- Records dropped by the exporter, the direct data-loss signal
- Export queue depth relative to capacity, your early warning minutes before drops start
- Export failure rate by status code, which distinguishes Loki being down from Loki rejecting you
- Collector CPU and memory against limits, usually the first symptom of an expensive OTTL statement
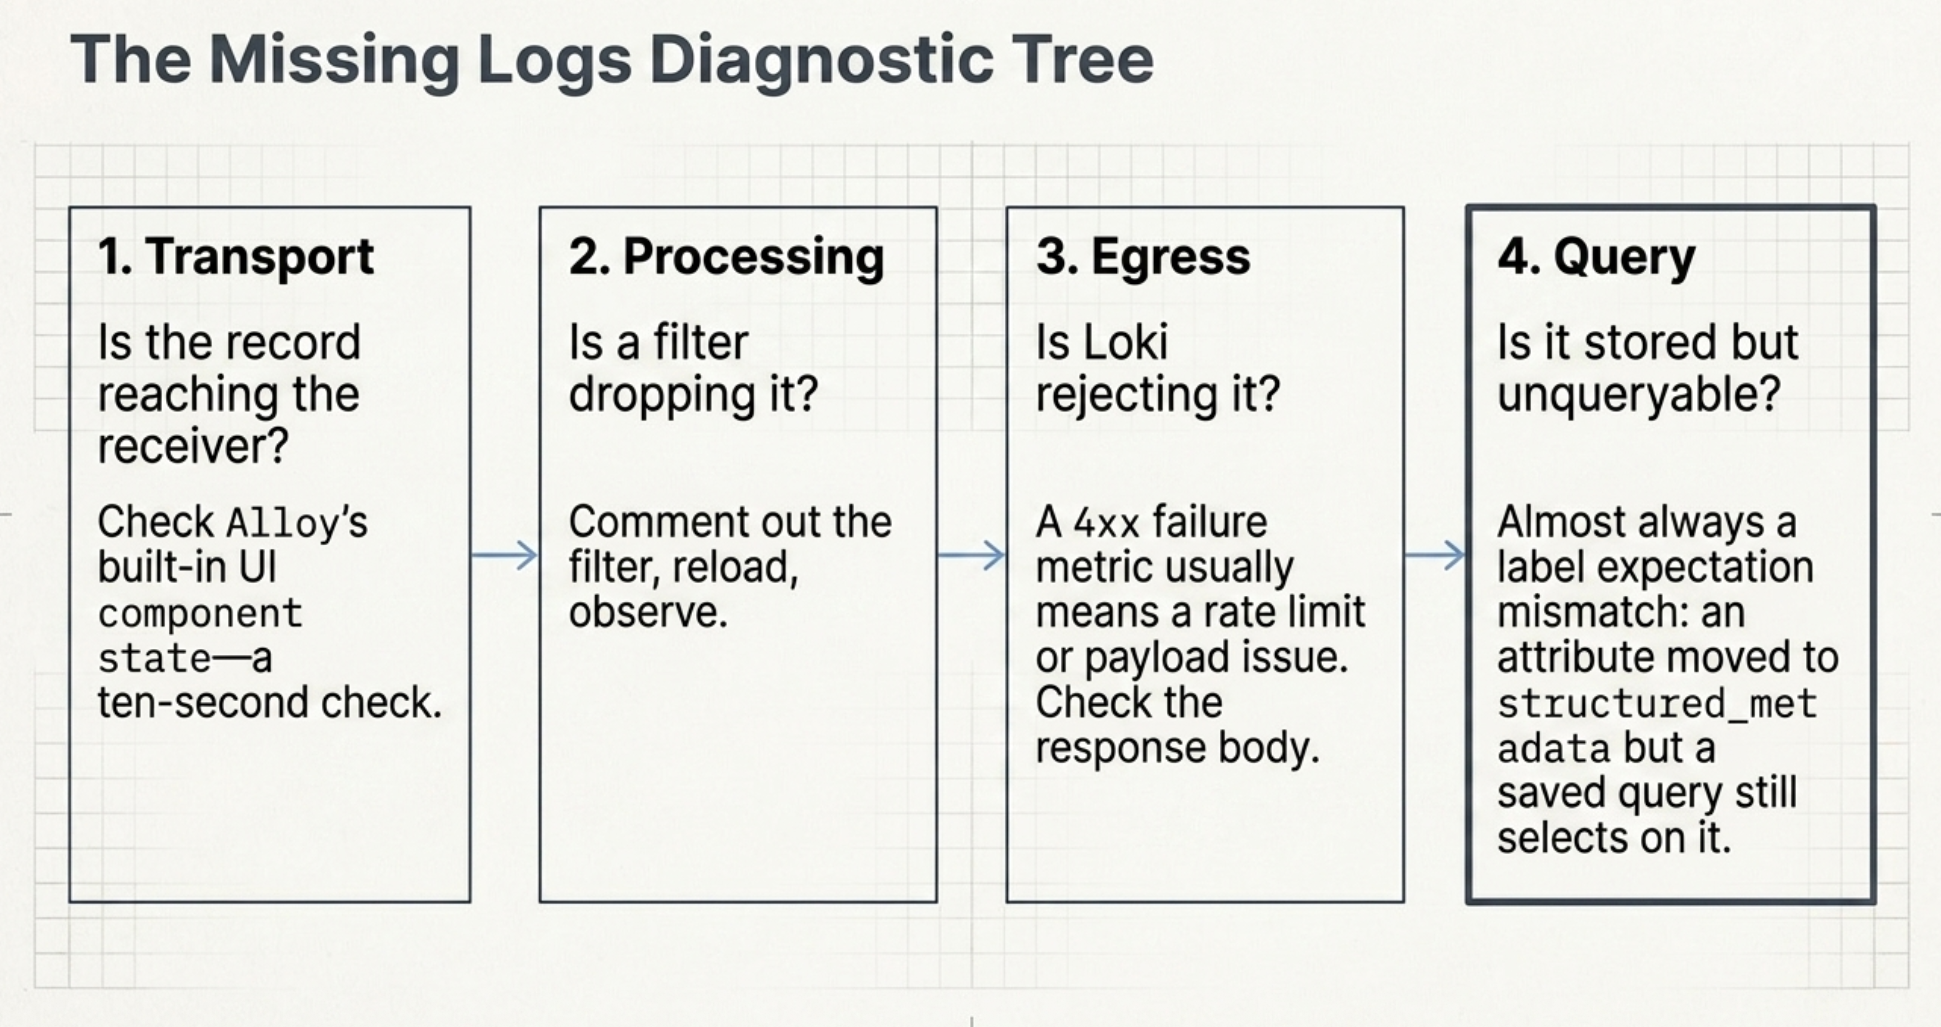
Troubleshooting order. When logs go missing, check in this sequence, because it moves from cheapest to most expensive:
- Is the record reaching the receiver? Alloy's built-in UI shows live component state and makes this a ten-second check.
- Is a filter dropping it? Comment the filter, reload, observe.
- Is Loki rejecting it? A 4xx in the export failure metric usually means a rate limit or a payload issue rather than a network problem; the response body says which.
- Is it stored but unqueryable? Almost always a label expectation mismatch: something moved from
index_labeltostructured_metadataand a saved query still selects on it.
That last case is the one that generates the most confused tickets after a migration, and it is the reason Part 1 flagged the LogQL rewrite as real migration work. Publishing a short before-and-after query cheat sheet alongside the rollout saves your team a week of one-off support conversations, and saves the developers on the other end from concluding that the new pipeline lost their data.
Wrapping up
The takeaway from both posts stands: you do not have to trade log context for cost anymore. Loki's native OTLP endpoint separates a small indexed label set from unbounded structured metadata, and Alloy gives you a programmable place to filter, redact, and enrich before anything is stored. Get the four decisions right, which are ingress, transformation, label policy, and failure behavior, and the rest is maintenance.
What this actually buys the people around you: developers stop being told to log less; the on-call engineer can filter by trace ID and customer tier without a parser stage and without a query timeout; the platform team can change label policy centrally instead of negotiating it service by service; and finance gets a log bill that tracks something explainable. Those are four different conversations that all stop being adversarial at the same time.
We covered the four sections promised: the minimum viable pipeline, shaping data in flight, controlling what becomes a label, and operating it in production.
Next steps, in order:
- Stand up the three-component pipeline in a non-production cluster and confirm end-to-end delivery.
- Add a filter for health-check and probe traffic and measure the volume reduction. This is your business case.
- Audit your
otlp_configand movek8s.pod.nameandservice.instance.idtostructured_metadata. - Configure a bounded, persistent export queue and alert on queue depth before you cut over production traffic.
- Publish a LogQL before-and-after cheat sheet for your teams ahead of the migration, not after.
This is the second half of a two-part series. Part 1 covers why traditional pipelines break on index cardinality, what Loki's native OTLP endpoint changes about labels and structured metadata, and where Alloy fits as the policy tier.
If you would rather not plan the migration alone, talk to us. The ingestion change is small; the query surface is where the work is, and that is much cheaper to scope before the cutover than after.
What is the minimum Alloy configuration for sending OpenTelemetry logs to Loki?+
Three components. An otelcol.receiver.otlp listening on the standard gRPC and HTTP ports, an otelcol.processor.batch in the middle, and an otelcol.exporter.otlphttp whose client endpoint points at Loki's native OTLP path, http://loki:3100/otlp. The exporter appends /v1/logs itself, so the configured endpoint stops at /otlp. Stand exactly this up first and confirm a record goes in one end and appears in Grafana Explore at the other. Every processor you add later is far easier to debug once you know the transport itself is sound.
Where should the batch processor sit in the pipeline?+
First in the chain and last before export. Everything downstream of the batch processor operates on batches rather than on individual records, which is where the CPU savings come from, and batching also improves compression ratios while cutting the number of outbound HTTP requests. On a busy node that is the difference between thousands of small requests per minute and dozens of large ones. Putting expensive transforms ahead of batching means paying per-record overhead you did not need to pay.
Should I use error_mode ignore or propagate in the transform processor?+
For a shared pipeline serving teams whose log shapes you do not control, ignore is usually correct. It skips a failing OTTL statement and continues, so one team emitting an unexpected type does not stall everyone else's telemetry. propagate surfaces the error and can fail the whole batch, which is appropriate when you own every producer and would rather find out loudly that a record shape changed. The choice is really about blast radius: ignore contains a bad record to itself, propagate lets it take the batch with it.
Which attributes should become index labels in Loki?+
Only ones you would actually put in a {} stream selector to narrow a search, and only if their value set is bounded and small. service_name, service_namespace, deployment_environment_name, and cluster almost always qualify. pod, instance_id, request_id, user_id, and trace_id almost never do, because their cardinality is unbounded in practice. They also do not need to be index labels: structured metadata keeps them filterable in LogQL without a parser stage and without contributing to stream count. Anything you do not explicitly place in otlp_config lands in structured metadata by default, which is the right default to lean on.
How do I stop losing logs when Loki restarts?+
Configure the exporter's sending queue and retry behavior explicitly rather than relying on defaults. A queue sized to absorb a few minutes of outage converts a Loki restart, which tends to happen during exactly the incidents whose logs you most want, from a data-loss event into a brief delay. Enable persistent queueing so the buffer is written to disk and survives a collector restart too. Critically, set an upper bound on it: an unbounded queue grows until the collector runs out of memory, which turns a recoverable backend outage into an Alloy OOM that drops everything, a worse failure than the one you were mitigating.
My logs are missing after the migration. How do I find out where they went?+
Work from cheapest check to most expensive. First, is the record reaching the receiver? Alloy's built-in UI shows live component state and makes that a ten-second answer. Second, is a filter dropping it? Comment the filter out, reload, and observe. Third, is Loki rejecting it? A 4xx in the export failure metric usually indicates a rate limit or a payload problem rather than a network fault, and the response body tells you which. Fourth, is it stored but unqueryable? That last case is the most common one after a migration and is almost always a label expectation mismatch, where an attribute moved from index_label to structured_metadata and a saved query still selects on it.