Introduction: You Instrumented Everything. Why Hasn't MTTR Improved?
You instrumented 200 services with the OpenTelemetry SDK. You're sending metrics, logs, and traces to a backend. Your dashboards are live, your alerts are configured, and your team spent six months getting here.
And your mean time to resolution hasn't improved.
The traces are there, but nobody can find the right one during an incident. The metrics are flowing, but the signal-to-noise ratio is so poor that your on-call engineers have learned to ignore most alerts. The logs are being collected, but correlating a customer complaint to a root cause still requires a senior SRE with tribal knowledge and 45 minutes of manual investigation.
This is the gap that most organizations hit after their initial OpenTelemetry rollout. Instrumentation is necessary, but it's not sufficient. The distance between collecting telemetry and actually operating better is where the real work begins, and it's where the industry's understanding of observability is evolving most rapidly.
In this post, we'll trace the evolution of observability through its first two generations, explain why each transition happened, and make the case that observability in the AI era requires not just better tools but a fundamentally different architecture. It's also why we've partnered with Edge Delta to help our customers make that leap.
Observability 1.0: The Dashboard Era
The first generation of observability grew up alongside monolithic applications and early microservices. If you were running infrastructure in the 2010s, you know the pattern well.
Metrics lived in one tool. Prometheus, Graphite, or a vendor-specific agent collected CPU, memory, and request rates. Dashboards were the primary interface. Teams built walls of Grafana panels and watched them during deployments, hoping to spot anomalies by eye.
Logs lived in another. Splunk, ELK, or syslog aggregators ingested application logs. When something broke, engineers would SSH into boxes or search through log indices, trying to find the error message that matched the timeframe of the incident.
Traces, if they existed at all, were a luxury. Zipkin and Jaeger were emerging, but most organizations hadn't adopted distributed tracing. When they did, traces lived in yet another silo with no connection to the metrics or logs that would give them context.
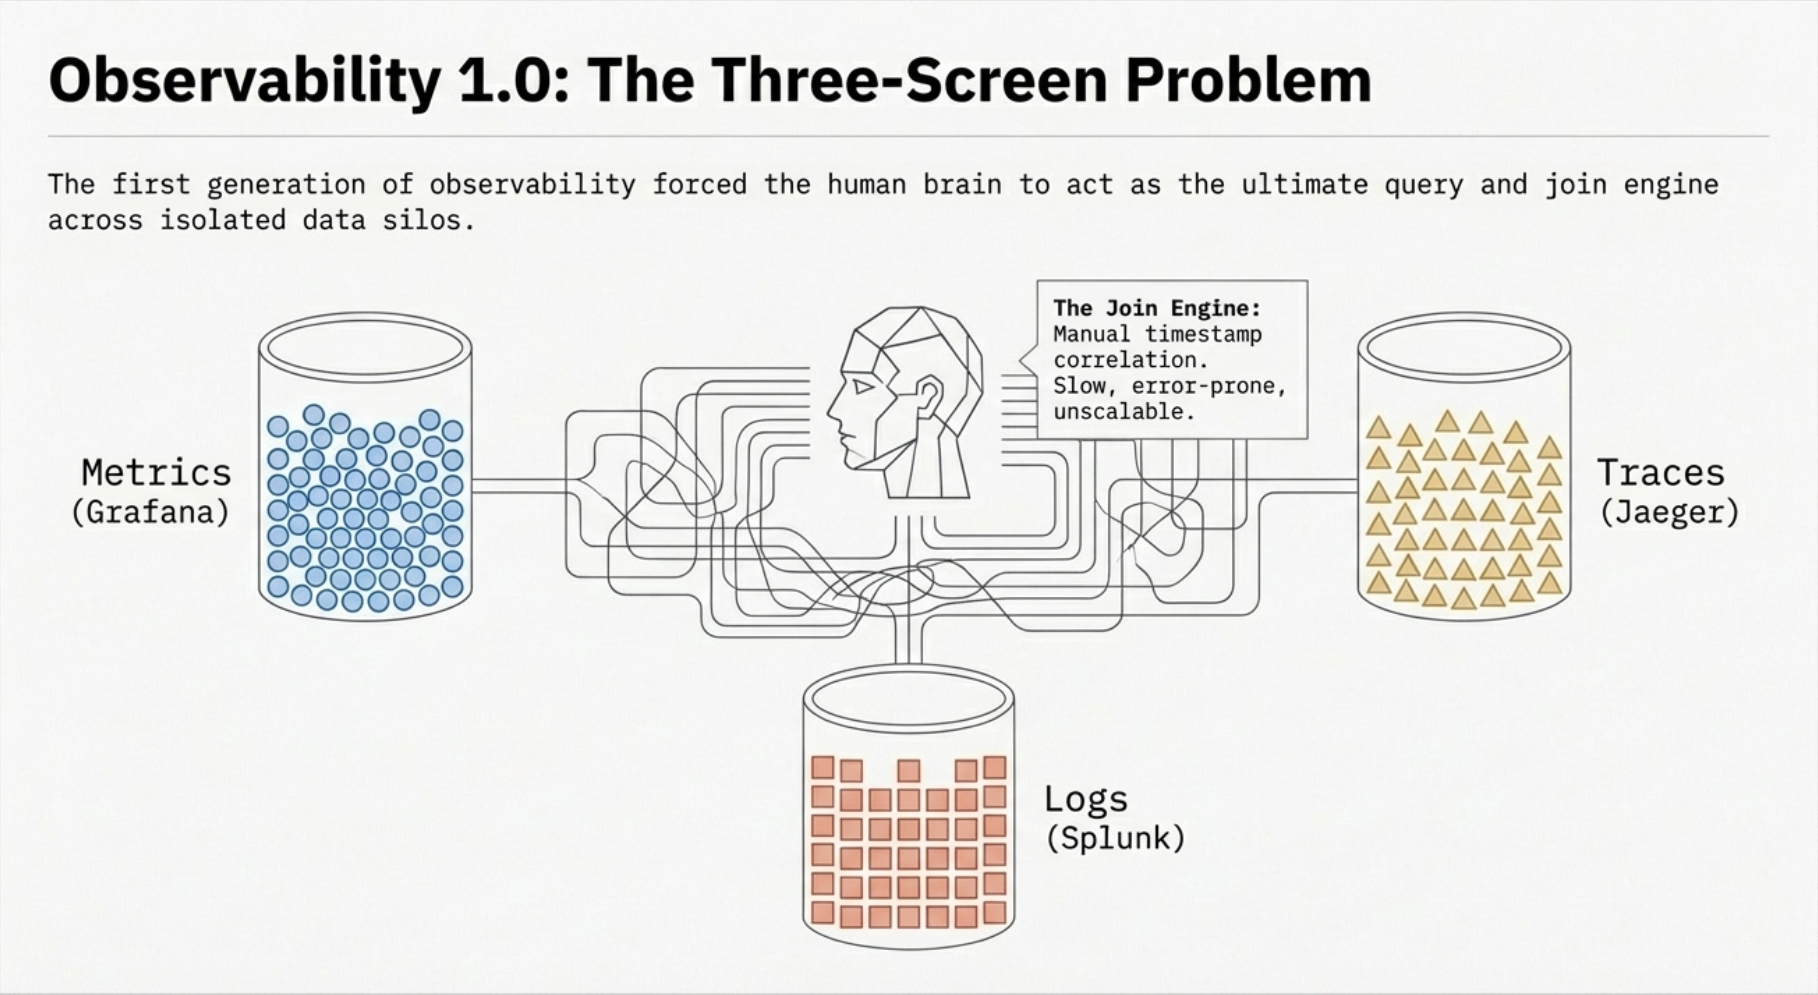
The result was a three-screen problem. During an incident, your SRE would have Grafana open on one monitor, Kibana on another, and maybe a terminal running kubectl on the third, mentally correlating timestamps across all three. The human brain was the join engine.
This worked, barely, when your architecture was simple enough that a single engineer could hold the entire system in their head. But as organizations moved to microservices, container orchestration, and multi-cloud deployments, the manual correlation model broke down. Incidents that should have taken minutes to resolve stretched into hours because the data existed but couldn't be connected.
Observability 2.0: The Unification Era
The second generation of observability emerged as a direct response to the silo problem. The core insight was straightforward: if metrics, logs, and traces all described the same systems, they should be collected, transported, and analyzed through a common framework.
OpenTelemetry became the standard. CNCF's OpenTelemetry project unified the instrumentation layer. A single SDK could emit metrics, logs, and traces with consistent metadata. Trace IDs could link a log entry to the span that generated it. Service names and resource attributes gave every signal a shared identity.
Distributed tracing went mainstream. Engineers could now follow a request from an API gateway through ten microservices to a database query and back. The waterfall view became the go-to diagnostic tool for latency investigations.
Backends consolidated. Vendors like Datadog, New Relic, and Grafana Cloud built platforms that ingested all three signal types and offered cross-signal correlation. The three-screen problem didn't disappear entirely, but it got significantly better.
Where Observability 2.0 Hits Its Limits
For many organizations, Observability 2.0 is where they are today. And for many, it's where they're stuck.
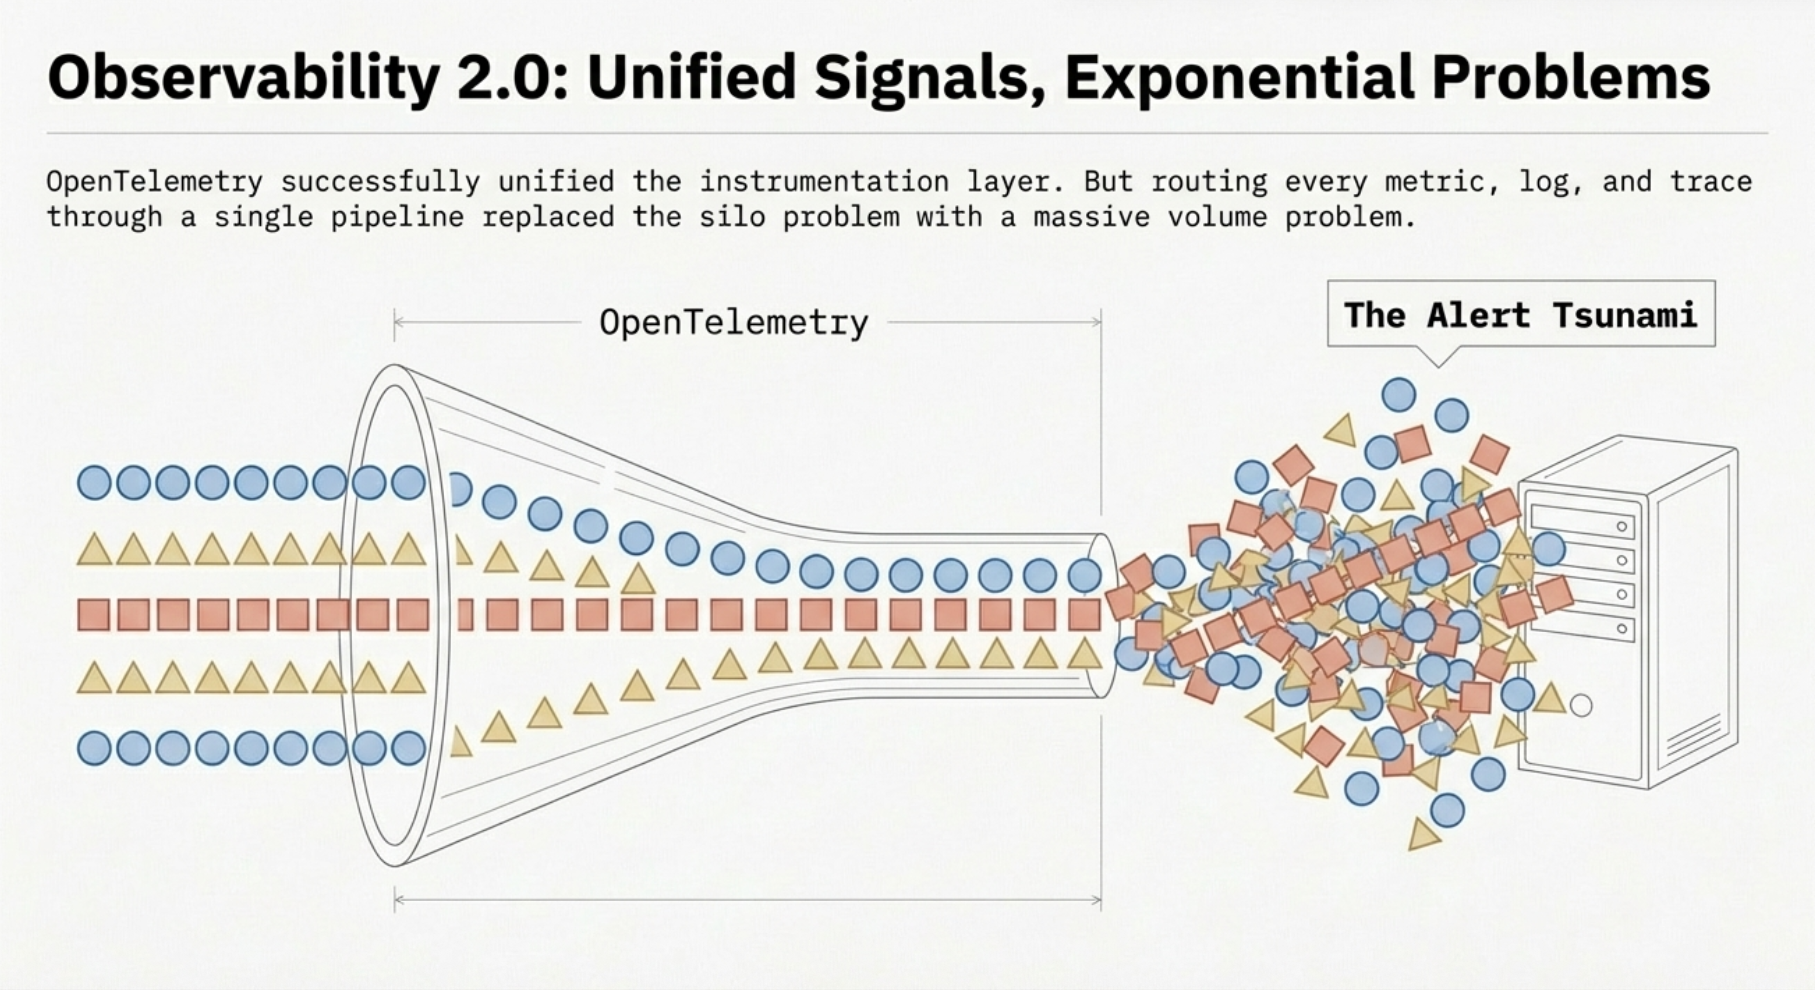
The cost problem. Unified telemetry means unified volume. When every service emits metrics, logs, and traces through a single pipeline, the data volume grows exponentially with your infrastructure. Organizations that started their OpenTelemetry journey with 50 services are now running 500, and their observability bill has grown from a line item to a board-level conversation. We've seen enterprises spending more on observability tooling than on the infrastructure they're observing.
The noise problem. More data doesn't mean more signal. Alert fatigue is endemic. Teams configure thousands of alerts, and on-call engineers learn to ignore most of them because too many fire on conditions that don't require action. The dashboards are prettier than they were in 1.0, but the fundamental dynamic hasn't changed: a human is still watching screens, waiting for something to look wrong.
The context problem. Raw telemetry tells you what happened but rarely why or so what. A spike in HTTP 500s is visible, but connecting it to the deployment that caused it, the customers it affected, and the business impact it created still requires manual investigation. The data is correlated at the signal level but disconnected from the business context that drives decisions.
The architecture problem. In most Observability 2.0 deployments, the telemetry pipeline is a dumb pipe. OpenTelemetry collectors receive data, maybe do some basic filtering or batching, and forward it to a backend. All the intelligence, the correlation, the analysis, the alerting, happens downstream, after every byte has been shipped and stored. This means you're paying to store data before you know whether it matters.
Why Observability Needs to Evolve Again
The limitations of Observability 2.0 aren't bugs. They're architectural constraints. The 2.0 model assumes that the right approach is to collect everything, ship everything, and let the backend sort it out. That assumption breaks down at scale.
Consider what happens when a major incident hits an organization running 500 instrumented services:
- Thousands of alerts fire across multiple services, most of them symptoms rather than causes
- Terabytes of telemetry are generated in the first few minutes, all shipped to a backend for analysis
- Engineers open dashboards and start the manual triage process: which alerts are real, which services are affected, what changed recently
- Correlation is manual. Someone notices that a deployment went out 10 minutes before the incident, but proving causation requires digging through traces, logs, and metrics across dozens of services
- Resolution comes slowly because the observability system is optimized for data collection, not for operational intelligence
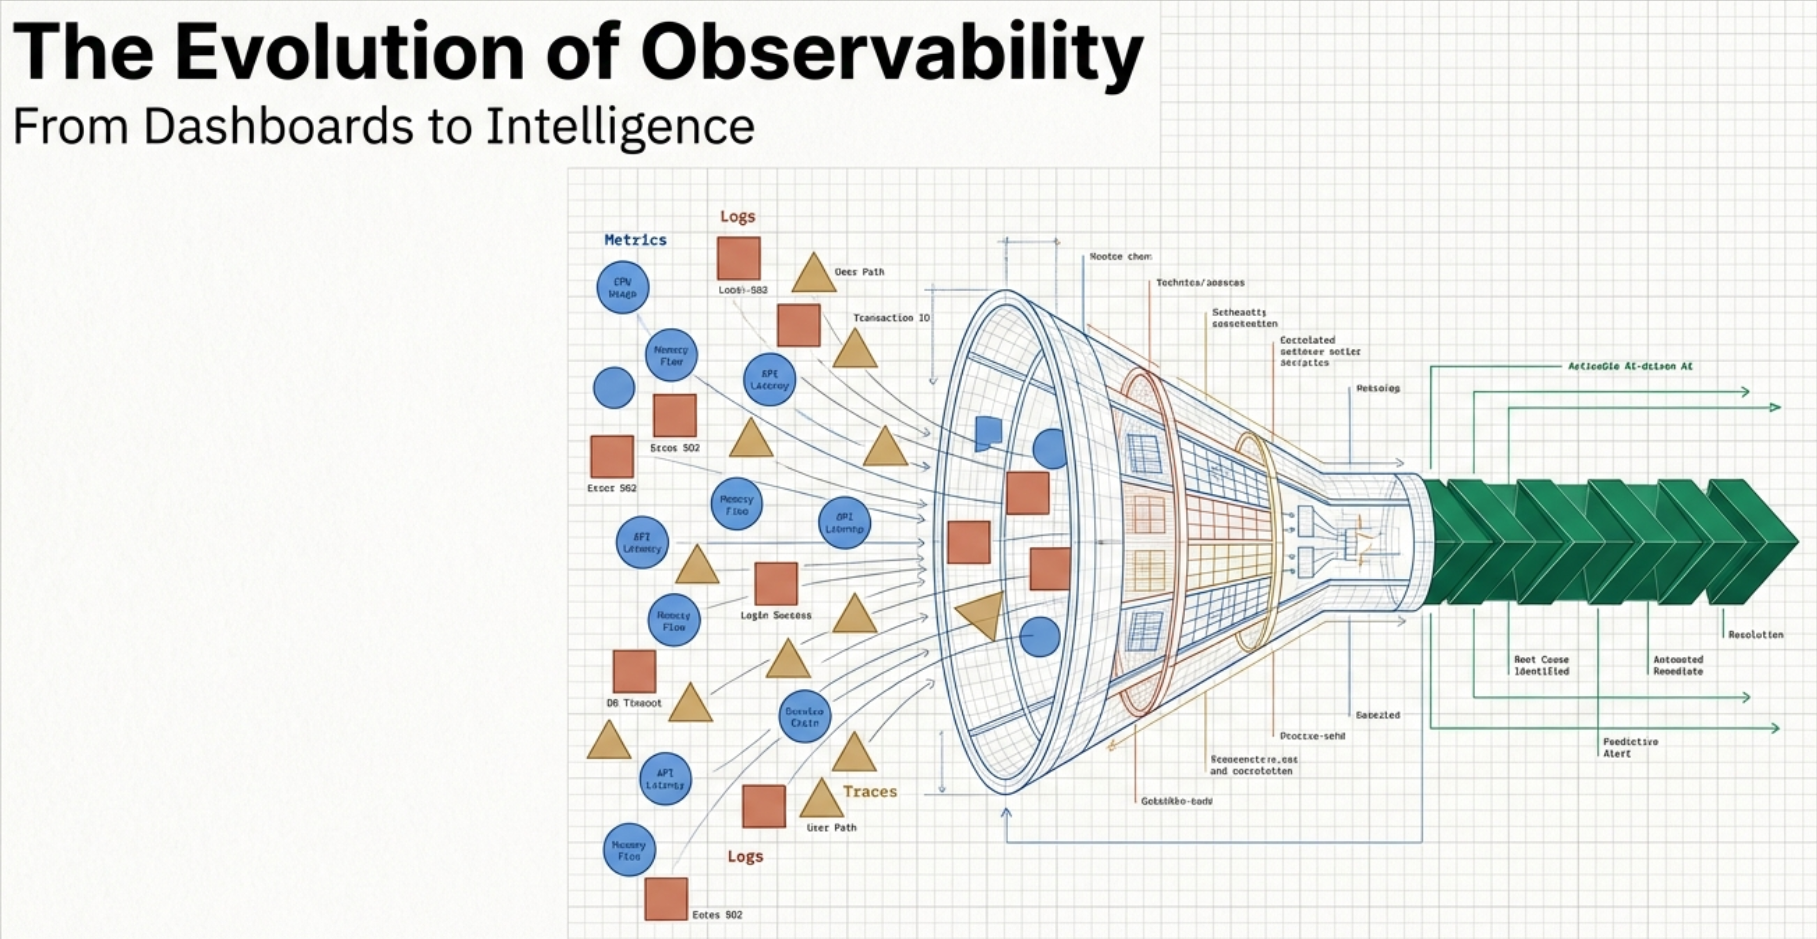
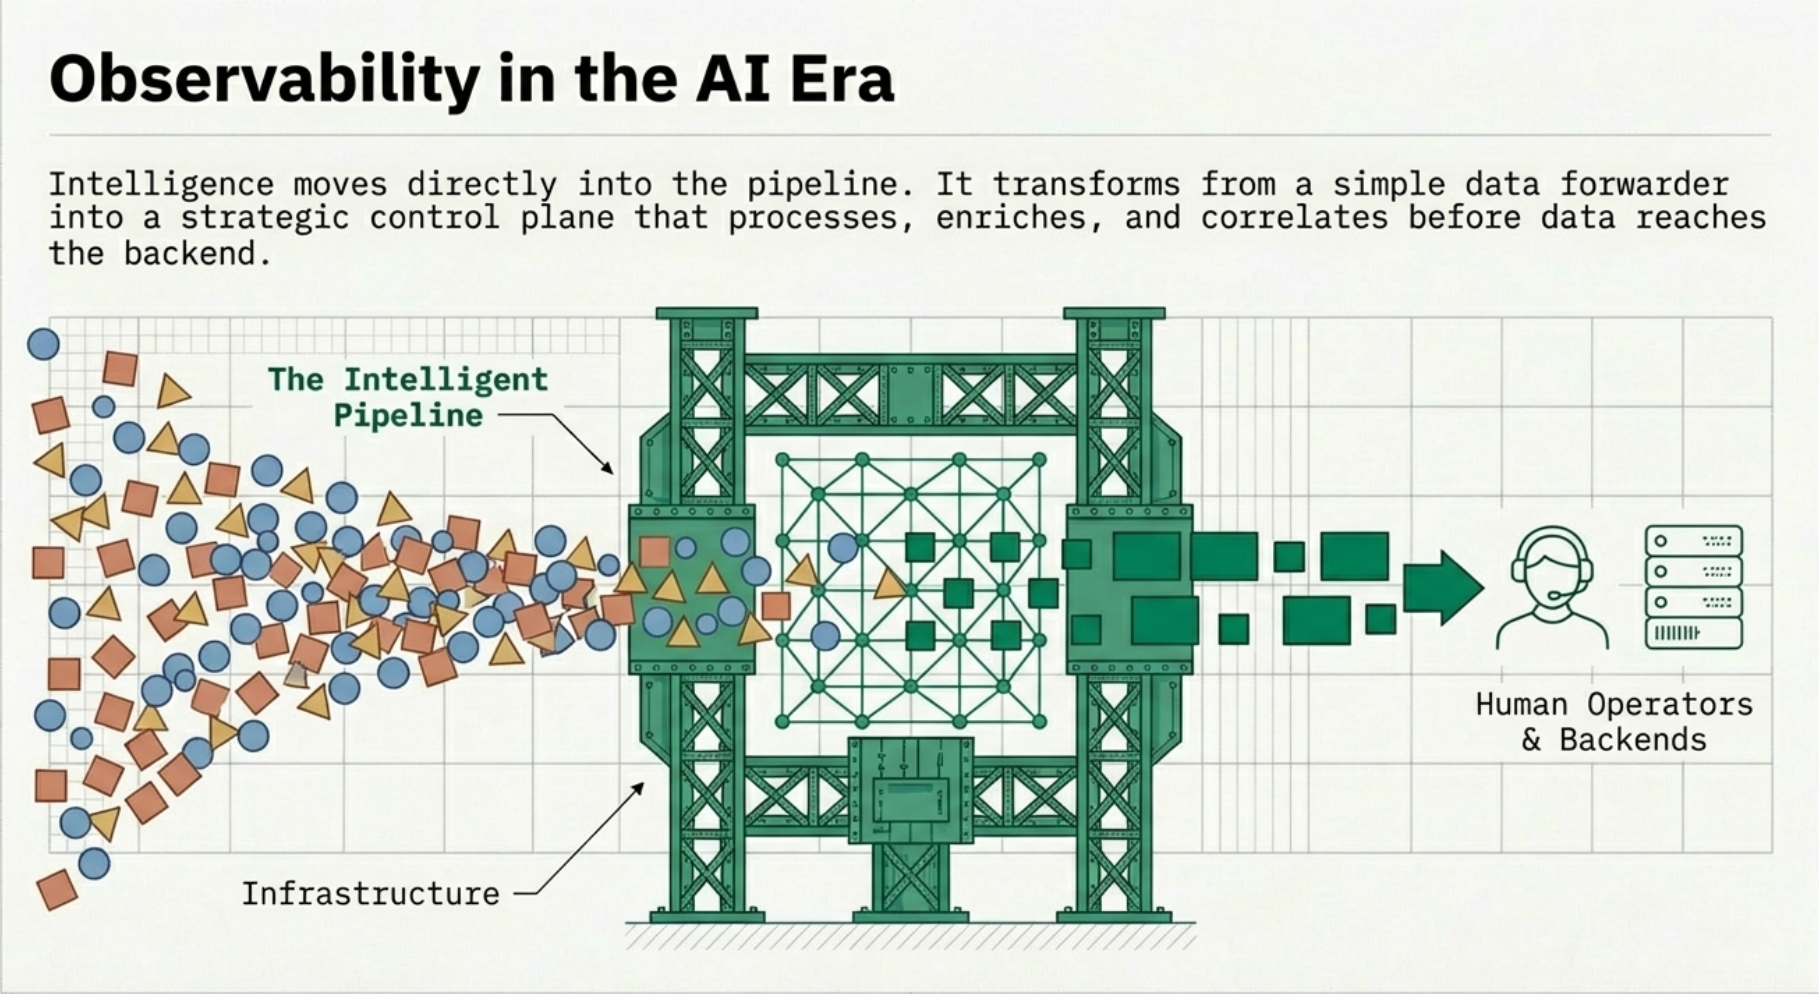
The fundamental issue is where intelligence lives in the stack. In Observability 2.0, intelligence is at the edges: in the human reading the dashboard, or in the backend's query engine running after data is stored. In the AI era, intelligence moves into the pipeline itself.
Observability in the AI Era: Intelligence at the Pipeline Layer
Observability in the AI era is not a product you buy. It's an architectural shift in how organizations think about telemetry. The core principles represent a move from data-centric to outcome-driven observability.
Signal-First, Not Tool-First
The AI-era approach starts with questions, not data:
- What decisions need to be automated? If a canary deployment shows elevated error rates, should the pipeline trigger an automatic rollback, or page a human?
- What data must be retained versus sampled? Error traces are always valuable. Successful health check traces almost never are. The pipeline should make that distinction before data hits storage.
- What context is needed for action? A CPU spike means nothing without knowing which service, which deployment, which customer cohort is affected.
Pipelines become the strategic control plane. OpenTelemetry collectors are no longer plumbing. They're the layer where data is shaped into signals that drive action.
Intelligent Data Reduction
Infinite data is impossible, and pursuing it is the fastest way to blow your observability budget. AI-era observability embraces intelligent reduction:
- Smart sampling and tail-based tracing keep the traces that matter and discard the ones that don't
- Cardinality controls prevent metric explosion before it reaches your backend
- Edge aggregation summarizes high-frequency data at the collection point rather than shipping every raw datapoint
- Tiered retention sends hot data to fast storage and cold data to cheap storage based on automated classification
Context Over Volume
The most important shift in the AI era is the move from "what happened" to "what happened, to whom, because of what." This requires enrichment at the pipeline layer:
- Business context: Which customer, tenant, feature flag, or cohort is affected?
- Topology awareness: What are the upstream and downstream dependencies of the affected service?
- Deployment context: What changed in the last hour? Which release, config change, or infrastructure modification correlates with the symptom?
- Ownership metadata: Which team owns this service? What SLO applies? Who gets paged?
When a pipeline enriches telemetry with this context before it reaches a backend, the difference in incident response is dramatic. Instead of "HTTP 500 rate increased on service-checkout," you get "HTTP 500 rate increased on service-checkout, affecting enterprise-tier customers in us-east-1, correlated with deployment v2.4.1 released 12 minutes ago, SLO breach in 8 minutes at current rate."
AI as a First-Class Citizen
In the AI era, intelligence isn't a chatbot bolted onto your dashboards. It's built into the pipeline:
- Automatic anomaly detection identifies deviations from baseline behavior without requiring manually configured thresholds
- Noise reduction suppresses duplicate and correlated alerts, surfacing a single root-cause signal instead of hundreds of symptoms
- Root cause assistance correlates symptoms across services and infrastructure layers to suggest probable causes
- Change correlation automatically connects anomalies to recent deployments, config changes, or infrastructure events
Actionability Over Visualization
If it doesn't drive action, it's waste. AI-era observability shifts the focus from "look at this dashboard" to "here's what you should do":
- Incident automation triggers runbooks, rollbacks, or scaling decisions based on pipeline-detected conditions
- Cost controls route, sample, or drop data based on its operational value, automatically
- Security and SRE workflows integrate directly with the telemetry pipeline rather than operating as separate systems reading from the same backend
Open and Vendor-Agnostic
The AI-era model requires open standards everywhere. No black-box agents. No proprietary protocols that lock your telemetry into a single backend. Swappable backends, cloud-agnostic collection, and support for hybrid and air-gapped environments are table stakes.
This is why OpenTelemetry remains the foundation. The difference is what you build on top of it.
Why We Partnered with Edge Delta
At Integration Plumbers, we've spent years helping enterprises design, build, and optimize their OpenTelemetry pipelines. We've seen firsthand the pattern described above: organizations invest heavily in instrumentation, achieve Observability 2.0, and then hit the wall of cost, noise, and manual correlation.
When we evaluated partners to help our customers make the leap to AI-era observability, Edge Delta stood out because their architecture embodies the principles we've been advocating.
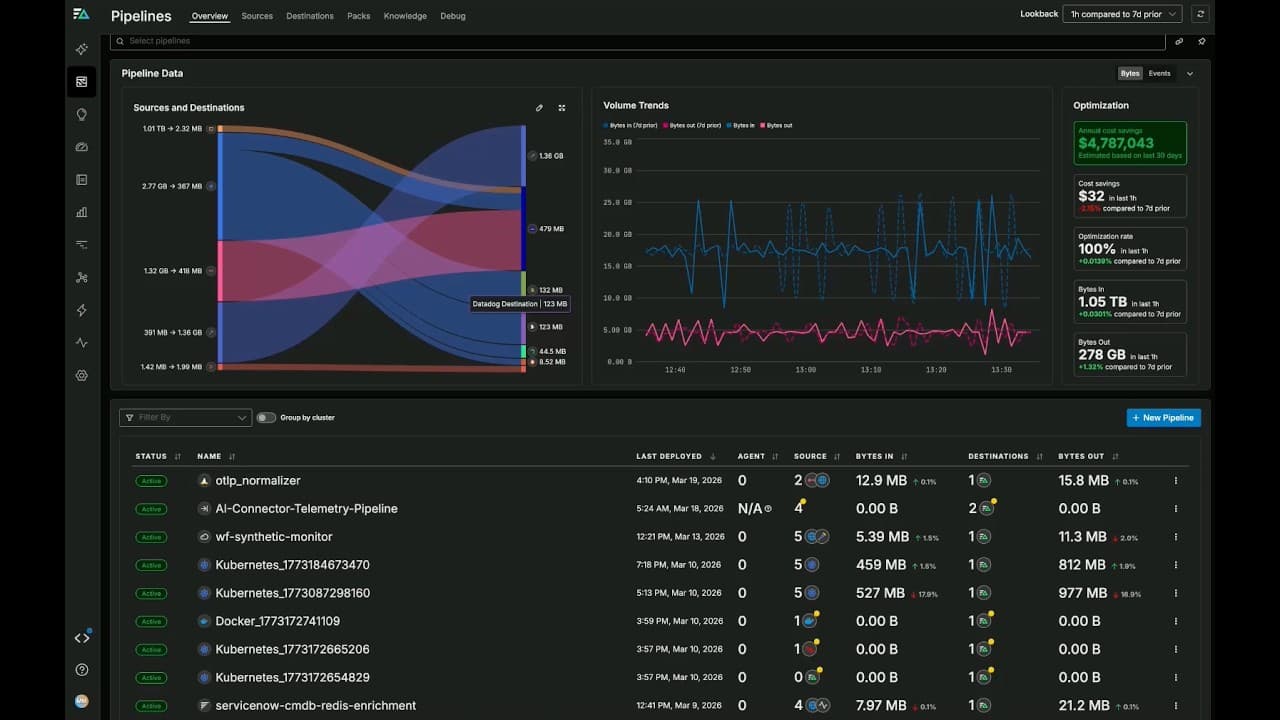
AI-driven analysis at the pipeline layer. Edge Delta's platform performs pattern detection, anomaly identification, and automatic correlation before data reaches storage. This is the "intelligence in the pipeline" architecture that AI-era observability demands. Instead of shipping every byte to a backend and running queries after the fact, Edge Delta surfaces actionable signals in real time.
Cost reduction through intelligent processing. By deduplicating, normalizing, and aggregating telemetry at the edge, Edge Delta dramatically reduces the volume of data that needs to be stored and queried. For our customers who are spending six or seven figures annually on observability backends, this translates into immediate, measurable savings.
Open standards, no lock-in. Edge Delta works natively with OpenTelemetry and supports multiple downstream backends. This aligns with our core philosophy: your observability architecture should serve your operational goals, not your vendor's revenue model.
Proactive, not reactive. The combination of Integration Plumbers' pipeline architecture expertise and Edge Delta's AI-driven processing moves our customers from reactive incident response to proactive operational intelligence. The pipeline doesn't just collect data. It tells you what's happening, why, and what to do about it.
What This Means for Our Customers
If you're an organization that has adopted OpenTelemetry and is struggling with rising costs, alert fatigue, or slow incident resolution, the path to AI-era observability isn't about adding another tool. It's about rearchitecting where intelligence lives in your telemetry pipeline.
Together, Integration Plumbers and Edge Delta offer:
- OpenTelemetry Pipeline Architecture Workshops to assess your current state and design an AI-ready pipeline
- OTel Pipeline Assessments that identify cost optimization opportunities and intelligence gaps
- Joint Proof of Concepts that demonstrate measurable improvements in MTTR, cost, and operational efficiency
Do I need to rip out my current observability stack to adopt AI-era observability?+
No. This is an architectural evolution, not a replacement. If you're already running OpenTelemetry collectors, the shift involves adding intelligence to your pipeline layer, not replacing your backends. Edge Delta integrates with your existing tools (Datadog, Grafana, Splunk, etc.) and adds the processing, enrichment, and AI-driven analysis that turns raw telemetry into actionable signals.
How is this different from just adding more dashboards or better alerting rules?+
Dashboards and alerting rules are Observability 2.0 solutions. They require humans to define what "bad" looks like in advance and then watch for it. AI-era observability uses AI-driven analysis to detect anomalies you didn't anticipate, correlate signals you wouldn't have connected manually, and surface root causes before your on-call engineer has finished reading the first alert. The intelligence is in the pipeline, not in the human staring at a screen.
What does the partnership between Integration Plumbers and Edge Delta look like in practice?+
Integration Plumbers brings deep expertise in OpenTelemetry pipeline architecture, custom collector development, and enterprise observability strategy. Edge Delta brings the AI-driven pipeline processing engine. Together, we design and implement the intelligent pipeline architecture that AI-era observability requires. In practice, this means Integration Plumbers leads the architectural design and OTel implementation while Edge Delta's platform provides the runtime intelligence layer.
Our observability costs are already out of control. Will adding another tool make it worse?+
The opposite. Edge Delta's intelligent processing reduces the volume of data shipped to and stored in your backend, often by 50-80%. By deduplicating, aggregating, and intelligently sampling at the pipeline layer, you're paying to store signals rather than noise. Most customers see a net reduction in total observability spend even after adding Edge Delta to their stack.
We're still early in our OpenTelemetry adoption. Is it too soon for AI-era observability?+
Early adoption is actually the best time to get the architecture right. Organizations that bolt on intelligence after the fact have to re-engineer their pipelines. If you're designing your OpenTelemetry deployment now, you can build AI-era principles into the foundation: intelligent sampling, context enrichment, and AI-driven processing from day one. This avoids the costly rearchitecture that organizations stuck in the 2.0 stage are facing today.
Ready to Move Beyond Dashboards?
If your team is feeling the limits of Observability 2.0, rising costs, alert fatigue, and slow incident resolution, we'd like to help you chart the path forward.
Integration Plumbers and Edge Delta are hosting a webinar on How to Leverage AI-Era Observability Through OpenTelemetry, where we'll dive deeper into these concepts with live architecture discussions and Q&A.
Or if you'd like to start a conversation about your specific environment: