The Accidental Observability Stack
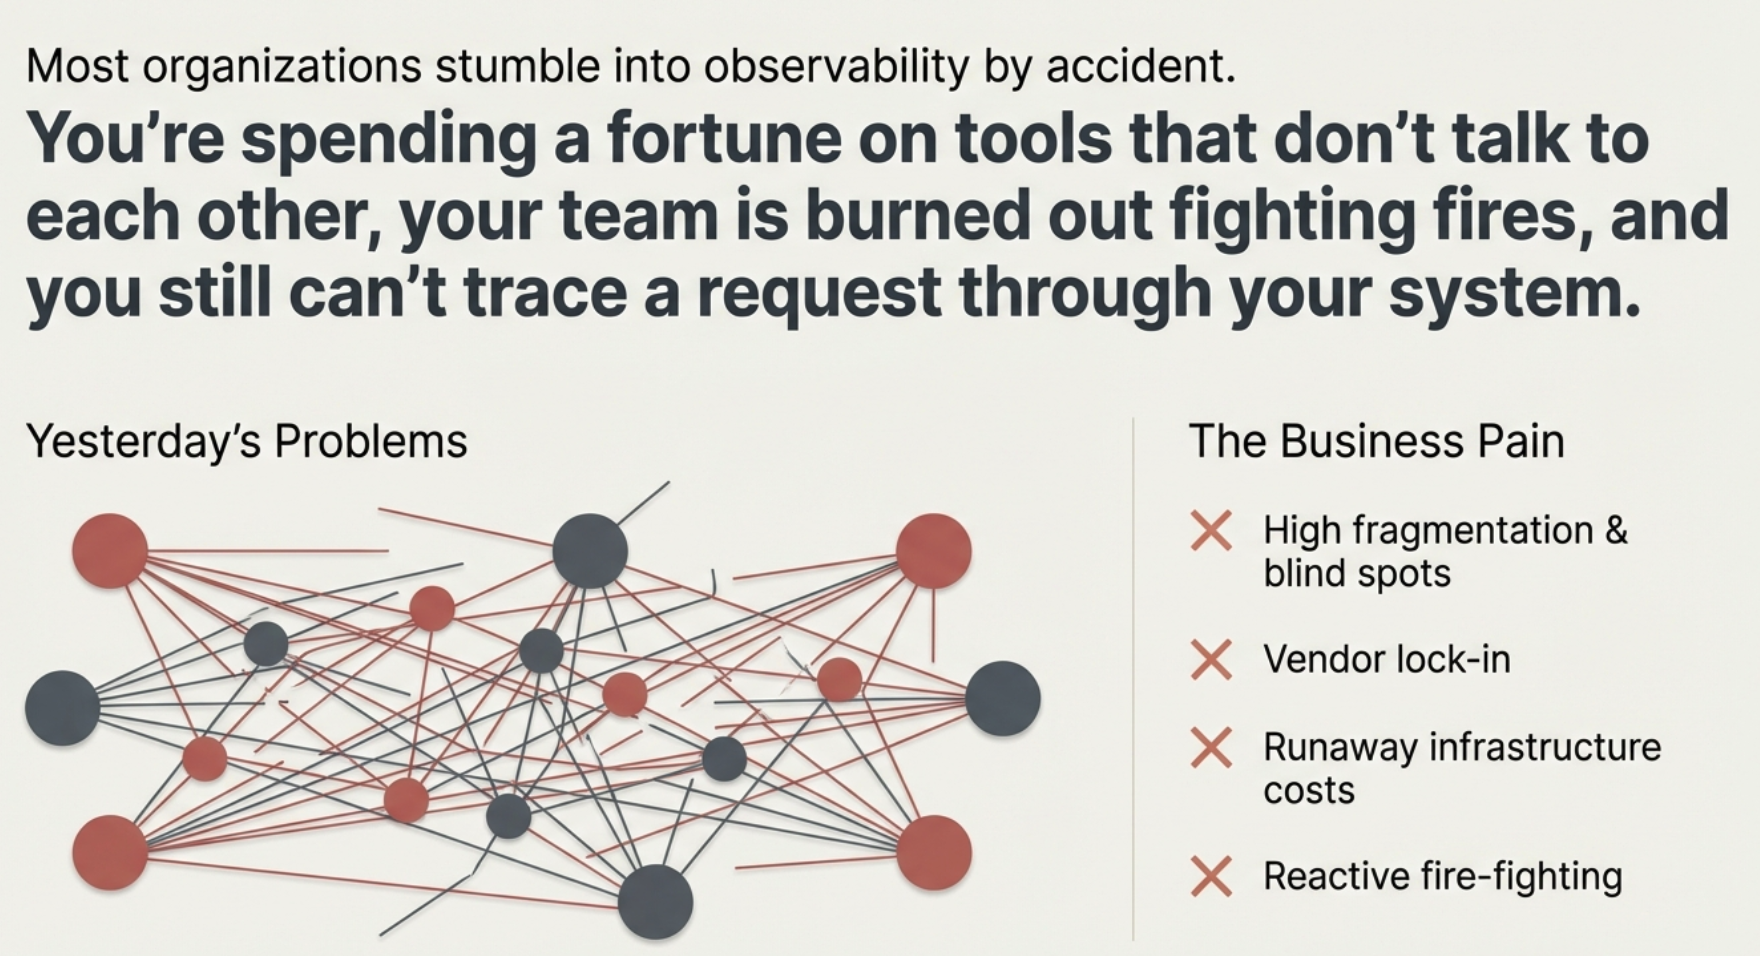
Most organizations stumble into observability by accident. A production incident occurs, suddenly you're desperate for visibility, and you quickly cobble together whatever tools and approaches seem immediately necessary. Over time, you accumulate log aggregation platforms, APM vendors, and monitoring dashboards — each solving yesterday's problems in isolation. Then one day, you realize you're spending a fortune on tools that don't talk to each other, your team is burned out fighting fires instead of building, and you still can't trace a request through your system without stitching together data from five different sources.
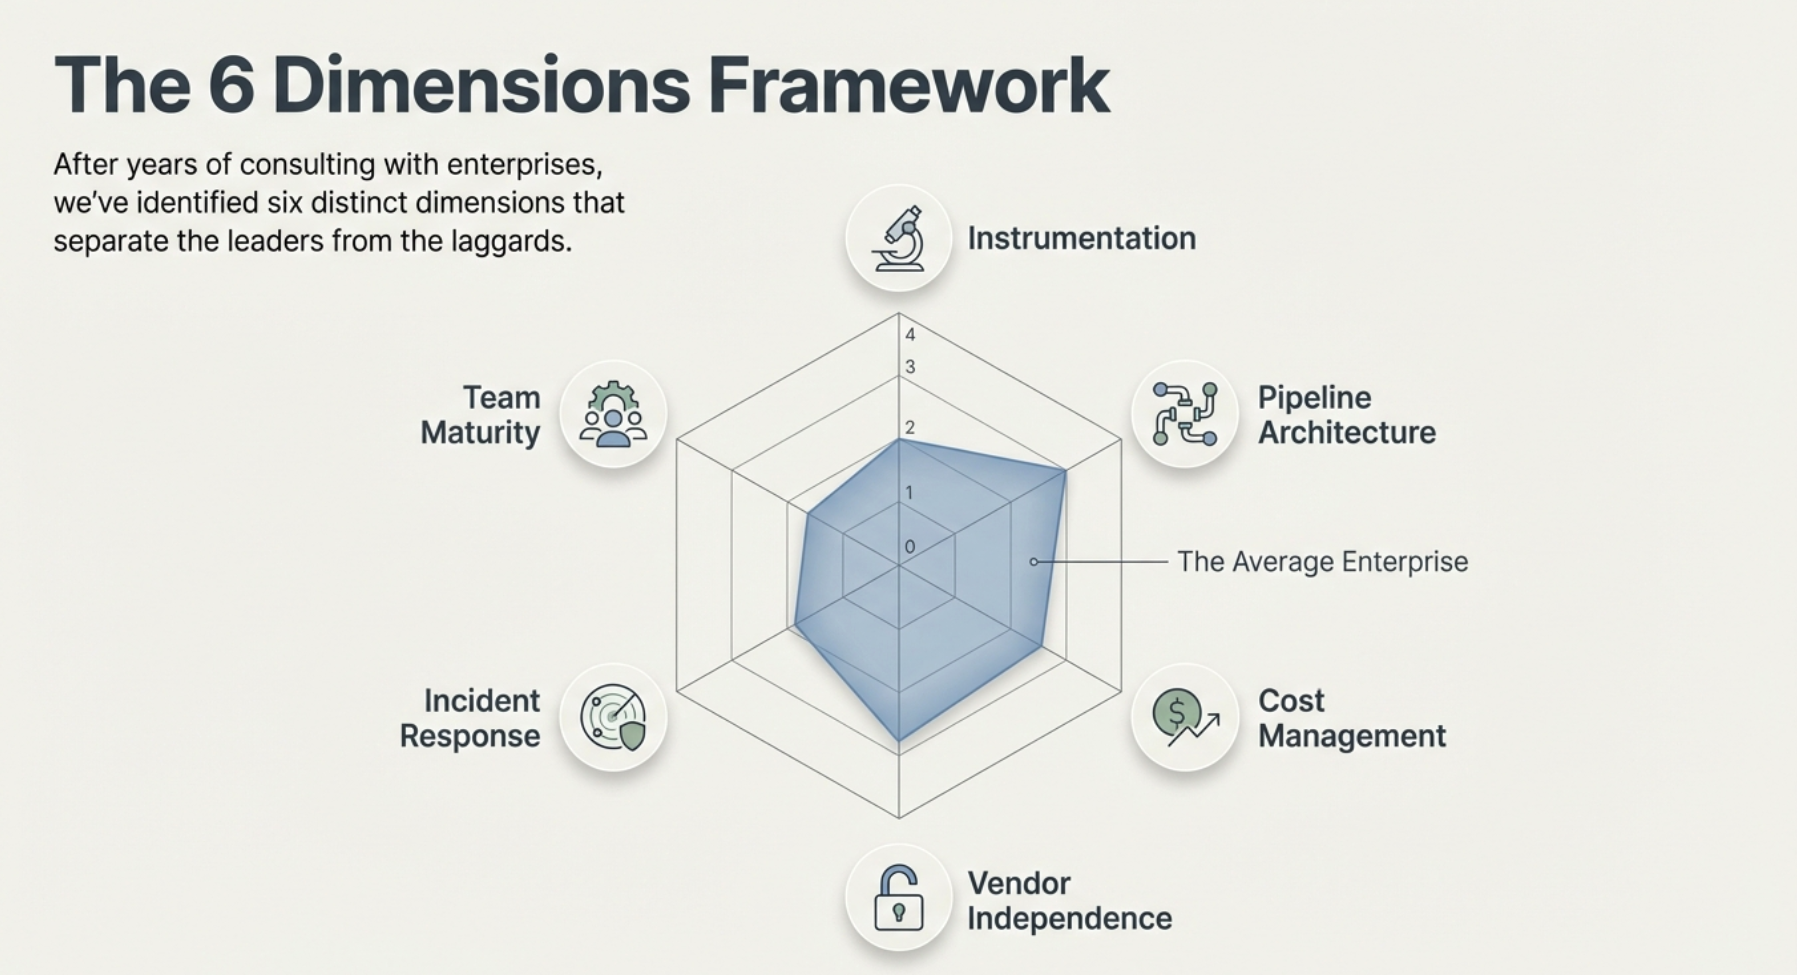
This is the reality for many enterprises today. Observability has become a critical competitive advantage, yet most organizations lack a structured framework to evaluate where they actually stand and what their path forward should look like. That's exactly why we developed the OpenTelemetry Maturity Assessment at Integration Plumbers. After years of consulting with enterprises large and small, we've identified six distinct dimensions that separate organizations that have mastered observability from those still struggling to get the basics right.
This assessment isn't about vendor lock-in or pushing a particular tool. It's about understanding your current state across the dimensions that actually matter: instrumentation depth, pipeline architecture, cost efficiency, portability, incident response capability, and team readiness. Where you land on this spectrum determines not just what you can observe, but what you can accomplish as a business.
Key Terms
OpenTelemetry (OTel): An open-source observability framework that provides vendor-neutral APIs, SDKs, and tools for generating, collecting, and exporting telemetry data (metrics, traces, and logs).
Observability Maturity: A measure of how sophisticated and effective an organization's ability to understand and debug its systems is, assessed across multiple dimensions from ad hoc monitoring to proactive, self-service platforms.
OpenTelemetry Collector: A vendor-agnostic data pipeline component that receives, processes, transforms, and exports telemetry data. Acts as a middleware layer between instrumentation and observability backends.
Telemetry Pipeline: The full data path from instrumentation source to storage and analysis backend, including any intermediate collection, transformation, sampling, and routing steps.
Vendor Lock-In: A situation where an organization's observability infrastructure is tightly coupled to a single vendor's proprietary APIs, data formats, or agents, making migration difficult and expensive.
Tail-Based Sampling: A sampling strategy that decides whether to keep or discard a trace after it has completed, allowing decisions based on the full trace context (errors, latency, etc.) rather than random selection at the start.
Semantic Conventions: Standardized attribute naming patterns defined by the OpenTelemetry project to ensure consistent telemetry across different languages, frameworks, and organizations.
Understanding the Six Dimensions
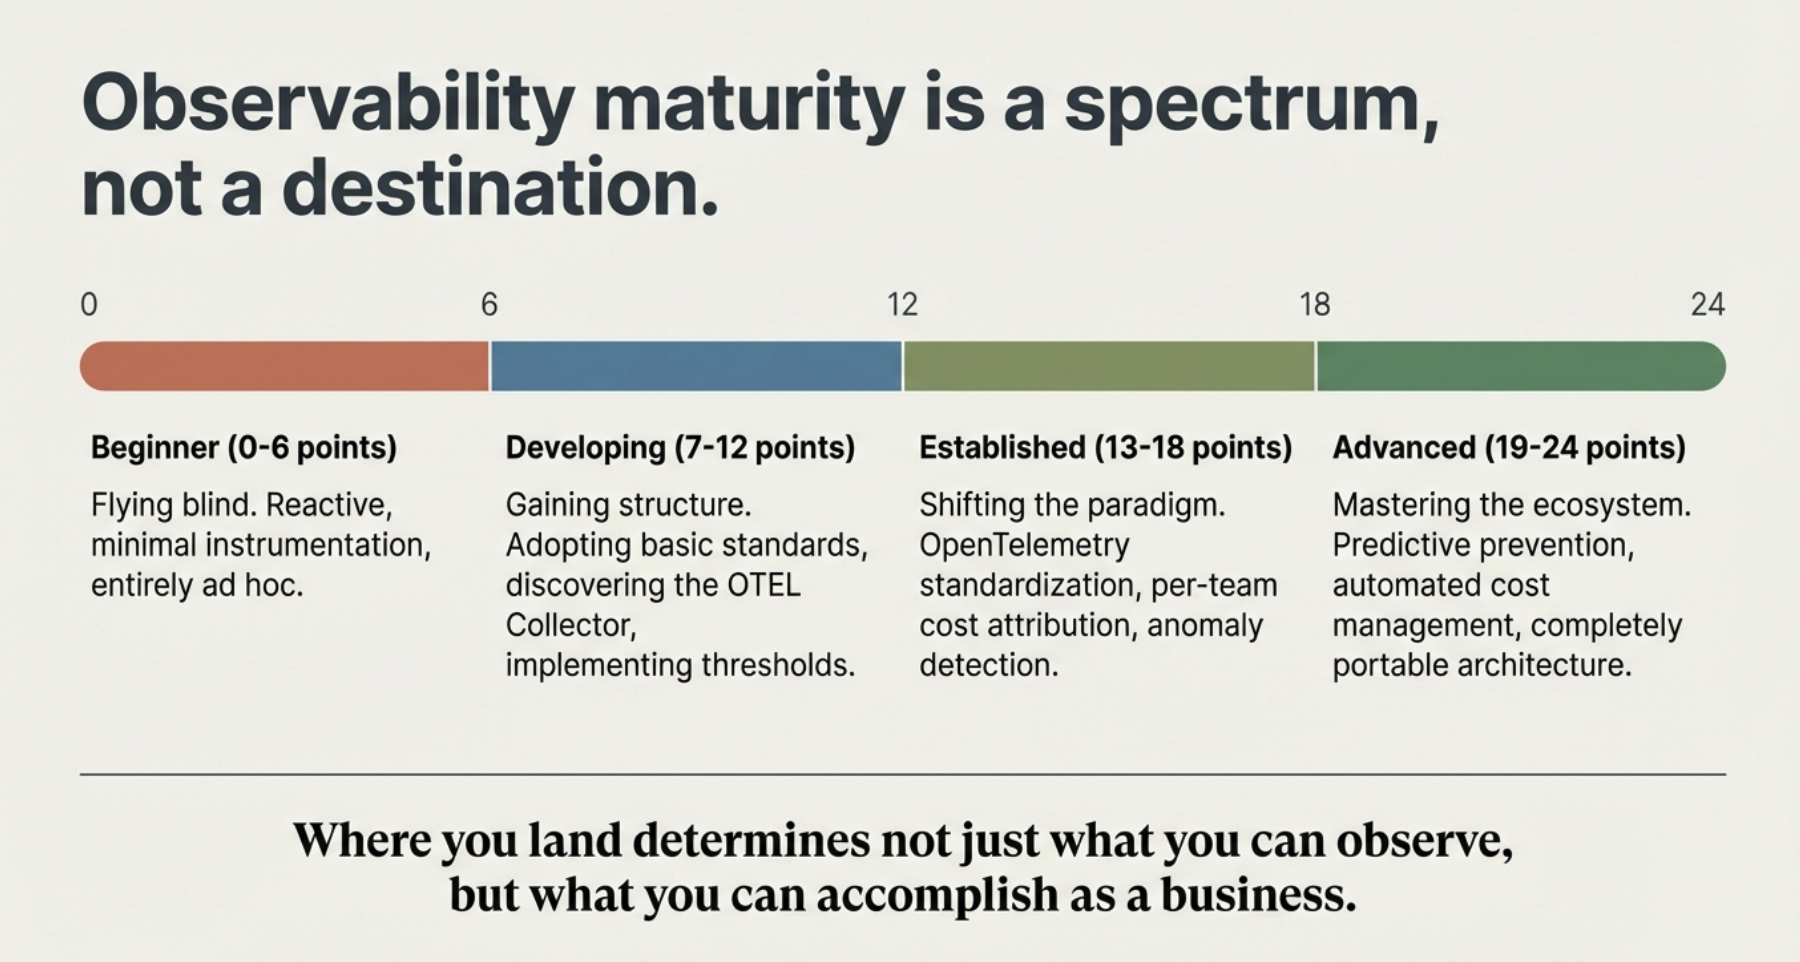
Observability maturity isn't binary. It's not a destination where you're suddenly "done." Instead, it exists across six interconnected dimensions that evolve together as your organization grows more sophisticated in how it understands and optimizes its systems.
At Integration Plumbers, we've worked with enterprises at every point on this spectrum — from startups transitioning from string-matching logs to structured instrumentation, to Fortune 500 companies breaking free from vendor lock-in and building cost-efficient, portable observability pipelines that scale across thousands of services.
The framework consists of six dimensions, each with a maturity level ranging from 0 to 4. These scores combine to give you a total maturity score: Beginner (0–6 points), Developing (7–12 points), Established (13–18 points), or Advanced (19–24 points). More importantly, each dimension tells a story about a different challenge your organization faces — and each requires a different set of solutions.
Dimension 1: Instrumentation — From Blind Spots to Complete Visibility
Instrumentation is the foundation of all observability. It's where you decide what to observe and how. Most organizations begin here out of sheer necessity, but they rarely invest in doing it comprehensively.
At the beginner level, instrumentation is minimal or nonexistent. You might have some application logs, perhaps a few basic server metrics, but you're essentially flying blind. Most of your understanding comes from after-the-fact analysis or customer complaints.
As organizations develop, they typically adopt an APM agent from a major vendor. This gives you request traces, latency metrics, and error tracking. It feels like a huge step forward — suddenly you can see the critical path through your system. The problem is that you're still locked into one vendor's instrumentation approach, and you're only getting what that vendor decided to instrument.
At the established level, organizations move to OpenTelemetry. This is the inflection point where things change fundamentally. OTel lets you instrument your applications once and send that telemetry anywhere. You're no longer betting your observability future on a single vendor.
Advanced organizations don't just adopt OpenTelemetry — they master it. They've instrumented their entire system with semantic conventions, created custom spans that capture business logic alongside technical metrics, and have the expertise to maintain and evolve that instrumentation as their system changes. Observability is a first-class concern in their architecture, not an afterthought.
Dimension 2: Pipeline Architecture — Building for Scale and Flexibility
How your telemetry flows from source to storage and analysis is what we call your pipeline architecture. This dimension often gets overlooked, but it's where many organizations discover they've built something unmaintainable.
Beginner organizations send data directly from applications to a backend — Datadog, New Relic, or some open-source option. As long as you're not sending much data, this works. The moment your observability budget becomes a concern — and it will — you're trapped. You can't filter data, enrich it with context, or handle backpressure.
Developing organizations discover the OpenTelemetry Collector. The Collector acts as a middleware layer that receives telemetry, transforms it, and forwards it to your backend. Suddenly you can filter low-value telemetry before it reaches your backend, enrich spans with infrastructure context, and handle temporary outages by buffering data locally.
Established organizations recognize that a single Collector instance isn't enough. They've built a fleet of Collectors deployed across multiple regions or clusters, with load balancing, failover, and redundancy. The Collector becomes the nerve center of their observability infrastructure.
Advanced organizations have fully optimized their pipeline architecture. They understand data flow at a granular level, have built self-service tools for Collector deployment, and use advanced features like tail sampling to intelligently reduce data volume while preserving signal. Their pipeline is a competitive advantage.
Dimension 3: Cost Management — From Reckless Spending to Intelligent Attribution
Observability infrastructure can become incredibly expensive very quickly. The irony is that better visibility often means more data, which means higher bills. Organizations that don't actively manage observability costs often find themselves paying tens of thousands of dollars monthly for visibility they only partially utilize.
Beginner organizations typically don't track costs at all. They have a bill from their observability vendor, they know it's growing, but they don't know why or how to fix it.
Developing organizations start asking questions. They begin tracking how much data different systems are generating and might implement sampling to reduce volume. But they still lack visibility into team-level spending.
Established organizations have implemented per-team cost attribution. They can tell you exactly how much each team's services are contributing to the overall observability bill. This creates accountability and encourages better instrumentation practices.
Advanced organizations have built automated cost management systems that adjust sampling strategies based on current spend versus budget. They've defined cost ownership policies and continuously optimize for cost-per-insight rather than just volume.
Dimension 4: Vendor Independence — From Lock-In to Portability
Vendor lock-in is one of the most expensive mistakes an organization can make in observability. Choose the wrong platform early, and you might find yourself unable to leave a decade later because your entire stack is built around that vendor's APIs and data formats.
Beginner organizations are typically locked in. They chose a major vendor years ago and their entire observability infrastructure depends on that vendor. When that vendor raises prices or disappoints them with a feature roadmap, they're stuck.
Developing organizations have recognized this problem and have likely identified OpenTelemetry as a path to independence. They might still be primarily sending data to their existing vendor, but they're instrumenting with OTel specifically so they retain the option to diversify.
Established organizations have actually implemented vendor independence — using multiple backends simultaneously and standardizing on OpenTelemetry so switching backends requires only a configuration change, not code rewrites.
Advanced organizations have built internal tools and abstractions that completely decouple instrumentation from any vendor's implementation details. They've built a culture where portability is a first-class architectural concern.
Dimension 5: Incident Response — From Reactive Triage to Proactive Prevention
How quickly and effectively you can respond to incidents often comes down to how well you can observe your system.
Beginner organizations discover problems when customers report them. Your incident response team spends hours digging through logs and metrics trying to figure out what happened.
Developing organizations have implemented basic alerting — thresholds for critical metrics like CPU usage, error rate, and latency. A massive improvement over customer discovery, but you're still responding to problems that have already begun.
Established organizations have implemented anomaly detection and smarter alerting. Your system knows what "normal" looks like and can alert you when behavior diverges. You might also have implemented correlation — when errors spike, your system can automatically suggest which services changed recently.
Advanced organizations have moved from incident response to incident prevention. They're using observability data to predict future problems, monitoring trends to identify degradation before it becomes critical, and have runbooks tied to alerts that automatically mitigate common issues.
Dimension 6: Team Maturity — From Ad Hoc to Self-Service Platform
Perhaps the most overlooked dimension is team maturity. A sophisticated observability system is only valuable if your teams can actually use it effectively.
Beginner organizations rely on a small group of heroic individuals — the platform team or DevOps experts who understand how everything works. Everything is ad hoc.
Developing organizations have started creating documentation and standards. But when teams run into issues, they still need to escalate to the platform team.
Established organizations have built a self-service platform. Teams can instrument their applications and access observability data without needing permission or help from a central team.
Advanced organizations have built truly mature platforms where onboarding a new team takes hours, not weeks. The platform team has built automation and abstraction layers that make the complex infrastructure invisible. Training is comprehensive, and the platform continuously improves based on user feedback.
Putting It Together: Your Path Forward
These six dimensions are interconnected. You can't build an advanced pipeline architecture if your instrumentation is minimal. You can't achieve cost control without a solid pipeline. You can't achieve true vendor independence without comprehensive OpenTelemetry instrumentation. And none of it matters if your teams can't actually use the platform you've built.
The path from beginner to advanced is not obvious. Different organizations need to prioritize differently:
- A startup might focus on getting instrumentation right before worrying about cost management.
- An enterprise might need to tackle vendor independence as a strategic priority before optimizing incident response.
- A fast-growing company might invest in team maturity as a way to scale observability practices across new services.
Your individual dimension scores matter more than your total. An organization that scores 4 on instrumentation but 0 on cost management has very different problems than one that scores 2 on instrumentation but 4 on vendor independence. The first has deep visibility but no cost control. The second has built something portable but hasn't invested in the instrumentation to take full advantage of it.
Take the Assessment
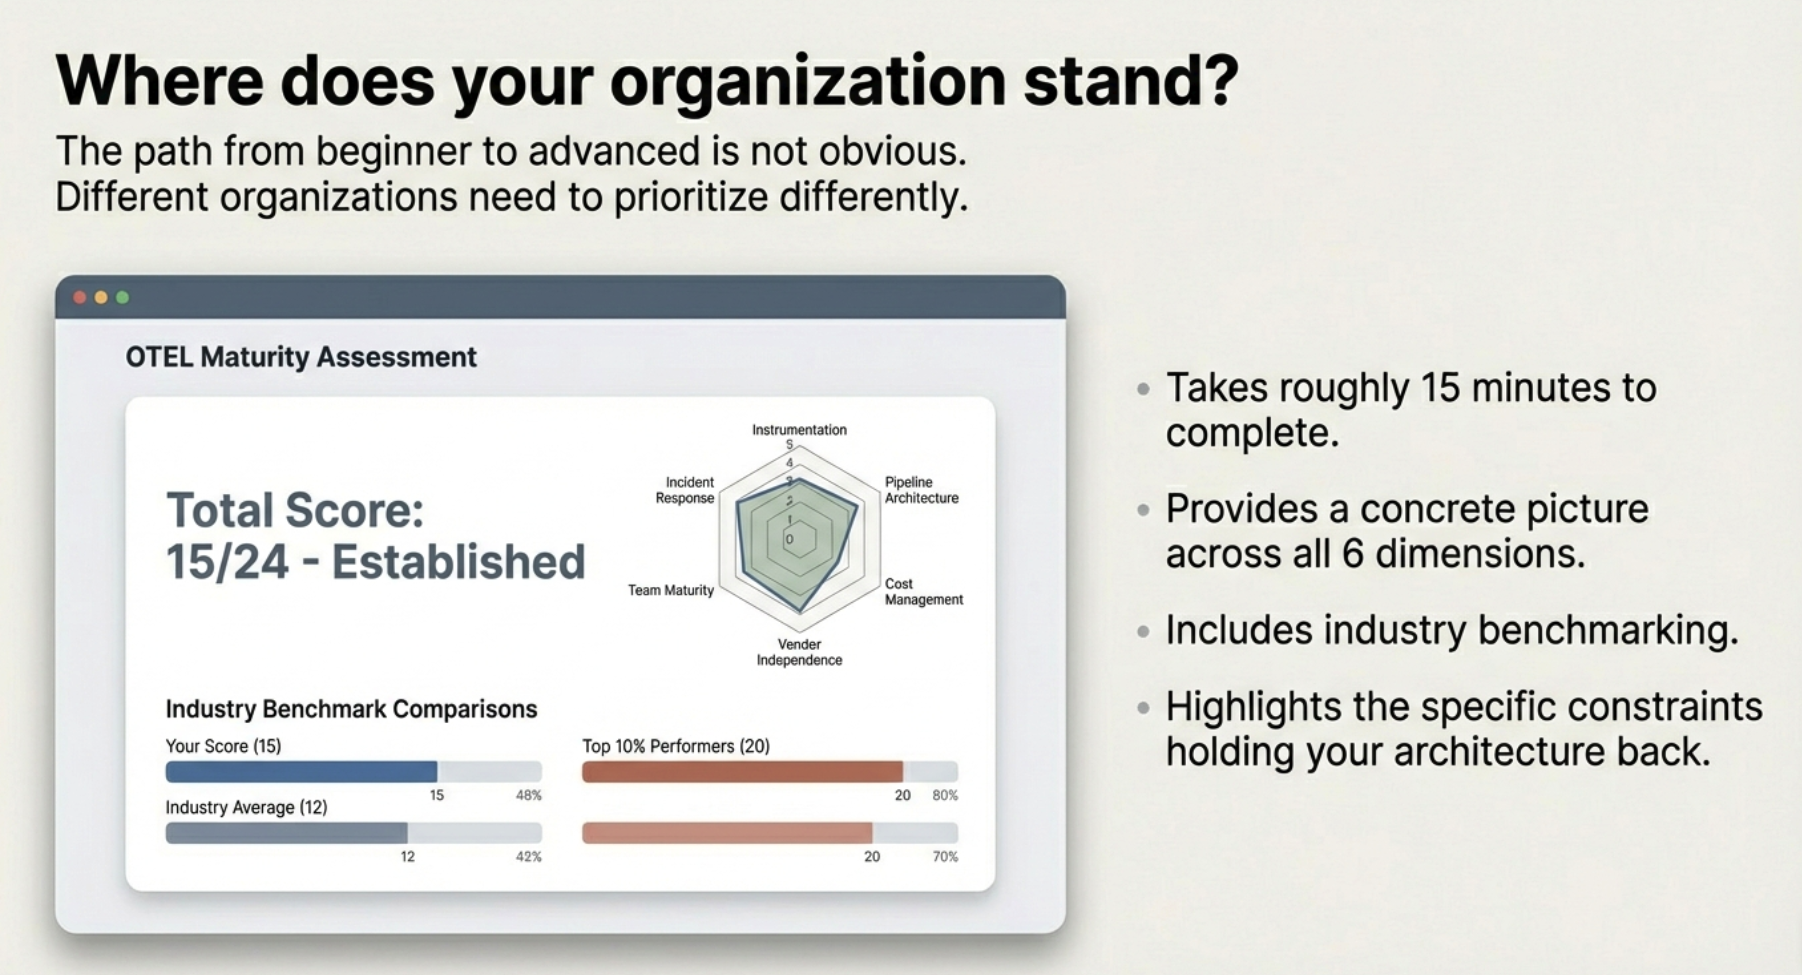
The OTEL Maturity Assessment is a free tool that takes about fifteen minutes to complete. It will give you a concrete picture of where your organization stands across these six dimensions and benchmarks showing how you compare to similar organizations.
Your results might surprise you. You might discover that you're more mature in some areas than you realized and significantly behind in others. From there, if you'd like to discuss a roadmap for advancing your observability, reach out to our team. We'd be happy to talk through where you stand and what's possible.
Your observability doesn't have to be a source of frustration and escalating costs. With the right framework and the right guidance, it can become a true competitive advantage — a system that gives you the insight you need to build better software faster.
How long does the OTEL Maturity Assessment take?+
About fifteen minutes. It evaluates your organization across six dimensions — instrumentation, pipeline architecture, cost management, vendor independence, incident response, and team maturity — and provides a maturity score with personalized recommendations.
What maturity level are most organizations at?+
Most organizations we work with fall in the Developing to Established range (7–18 points). They've made progress on instrumentation and basic pipeline architecture but have gaps in cost management, vendor independence, or team maturity. The good news is that the path from one level to the next is well-understood, and the ROI compounds at each stage.
Do we need to adopt OpenTelemetry to improve our maturity score?+
OpenTelemetry is the clearest path to advancing across multiple dimensions simultaneously — it directly improves instrumentation, enables pipeline flexibility, and is the foundation of vendor independence. However, many of the cost management, incident response, and team maturity improvements can be pursued independently of your instrumentation approach.
Can we be advanced in one dimension but beginner in another?+
Absolutely, and this is more common than you'd think. We regularly see organizations with sophisticated instrumentation (Level 3–4) but no cost attribution (Level 0–1), or strong vendor independence but weak incident response capabilities. The assessment is designed to surface exactly these imbalances so you can prioritize effectively.
What does a typical engagement look like after taking the assessment?+
We start with a 30-minute call to review your assessment results and environment. From there, we identify your top 3 quick wins (achievable in 30 days), a 90-day optimization plan, and a long-term architecture recommendation. Engagements range from targeted consulting on a specific dimension to full observability architecture design and implementation.