If you run PostgreSQL in production, there's a good chance Patroni is the thing keeping it highly available. And if your team also runs Oracle, there's a good chance your DBAs spend their day in Oracle Enterprise Manager. For everyone in that overlap, the question has always been the same: when a failover happens at 2 a.m., can the console you trust actually tell you what's going on?
With release 13.5.12 of our PostgreSQL Plug-in for Oracle Enterprise Manager, the answer is now yes, even in the middle of a failover. The plug-in can collect cluster health directly from the Patroni REST API instead of relying solely on SQL connections to the databases themselves. Your view of cluster topology and replication state no longer depends on the health of the very database you're trying to watch.
This post covers three things: the new Patroni REST API monitoring and why it matters, the other improvements that shipped in 13.5.12, and how existing customers can get the update.
Patroni Monitoring via the REST API
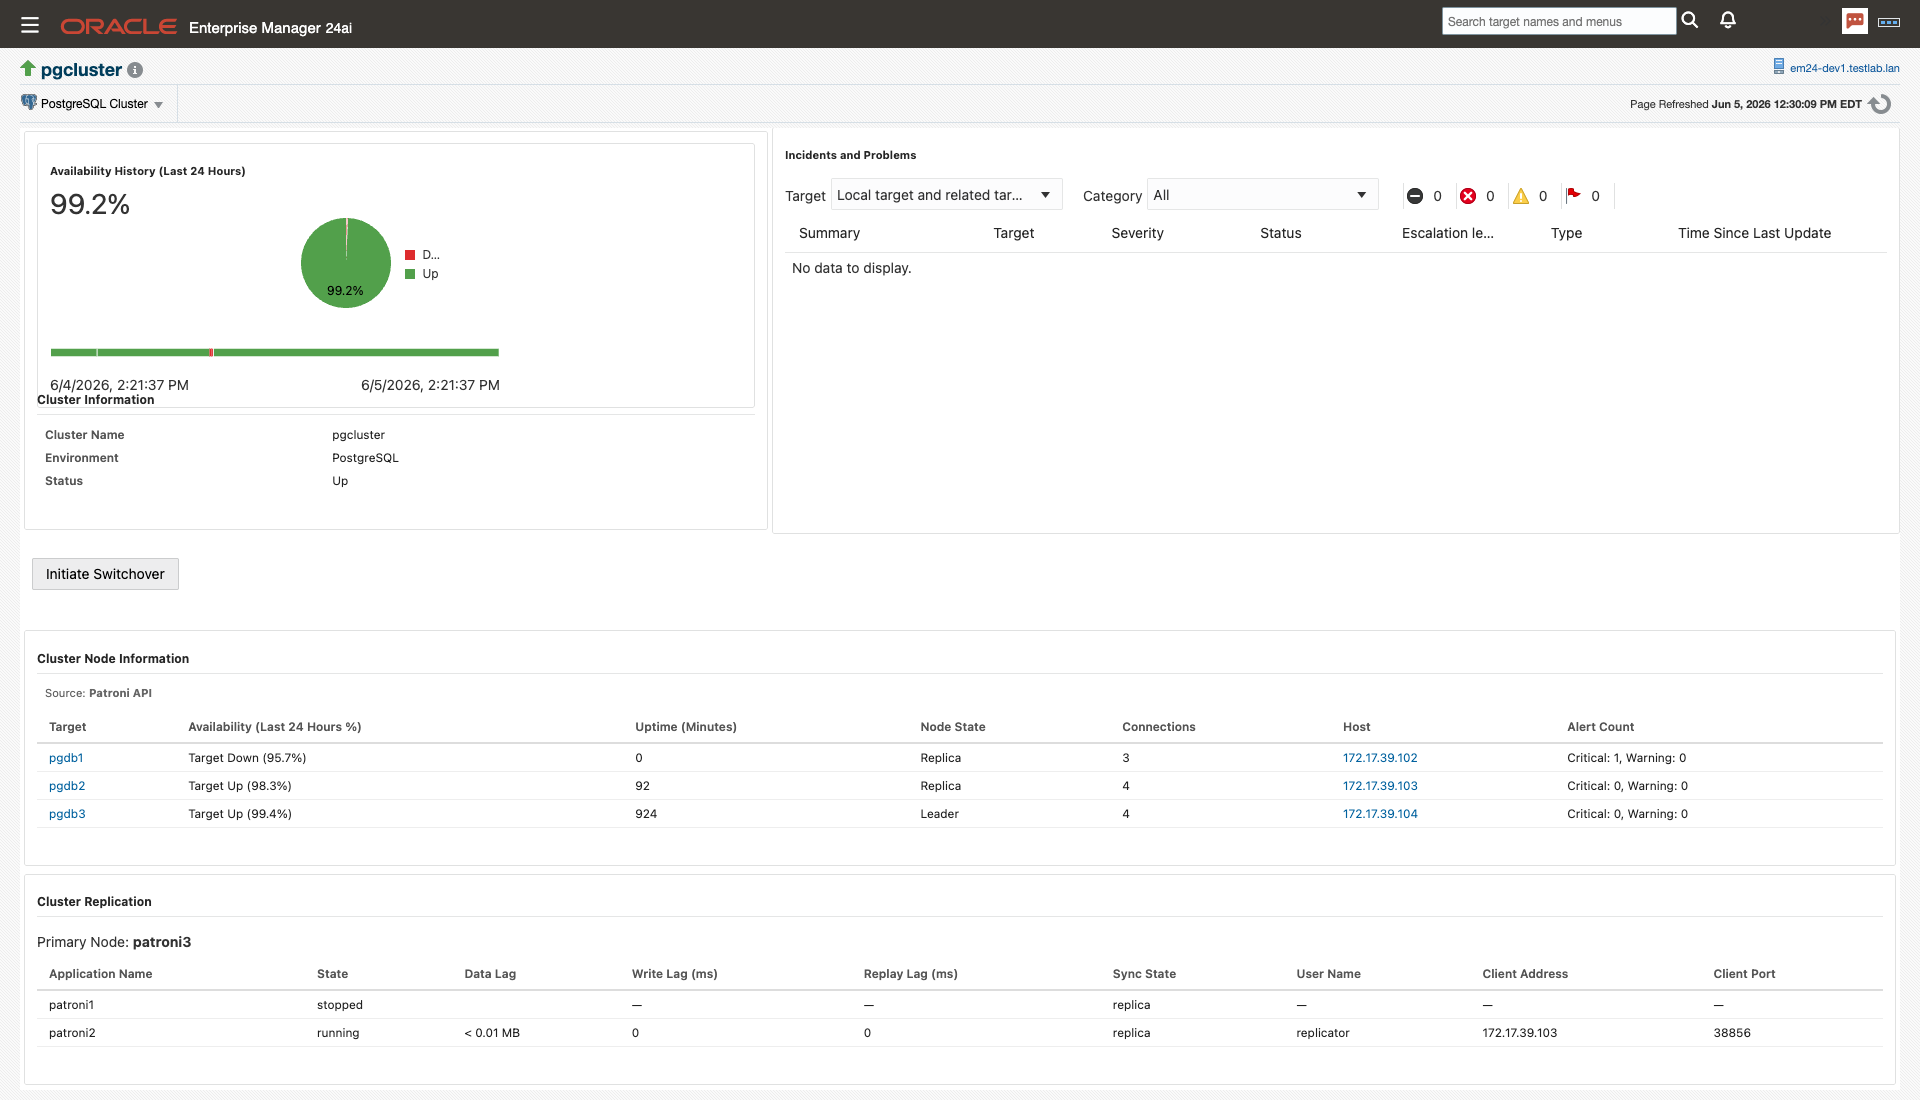
SQL-based cluster monitoring has a built-in catch-22. The monitoring agent connects to the primary, runs its queries, and reports what it sees. That works fine right up until the primary goes down, which is exactly when you need visibility most. The connection drops, the metrics stop, and your monitoring goes dark during the one event it exists to catch.
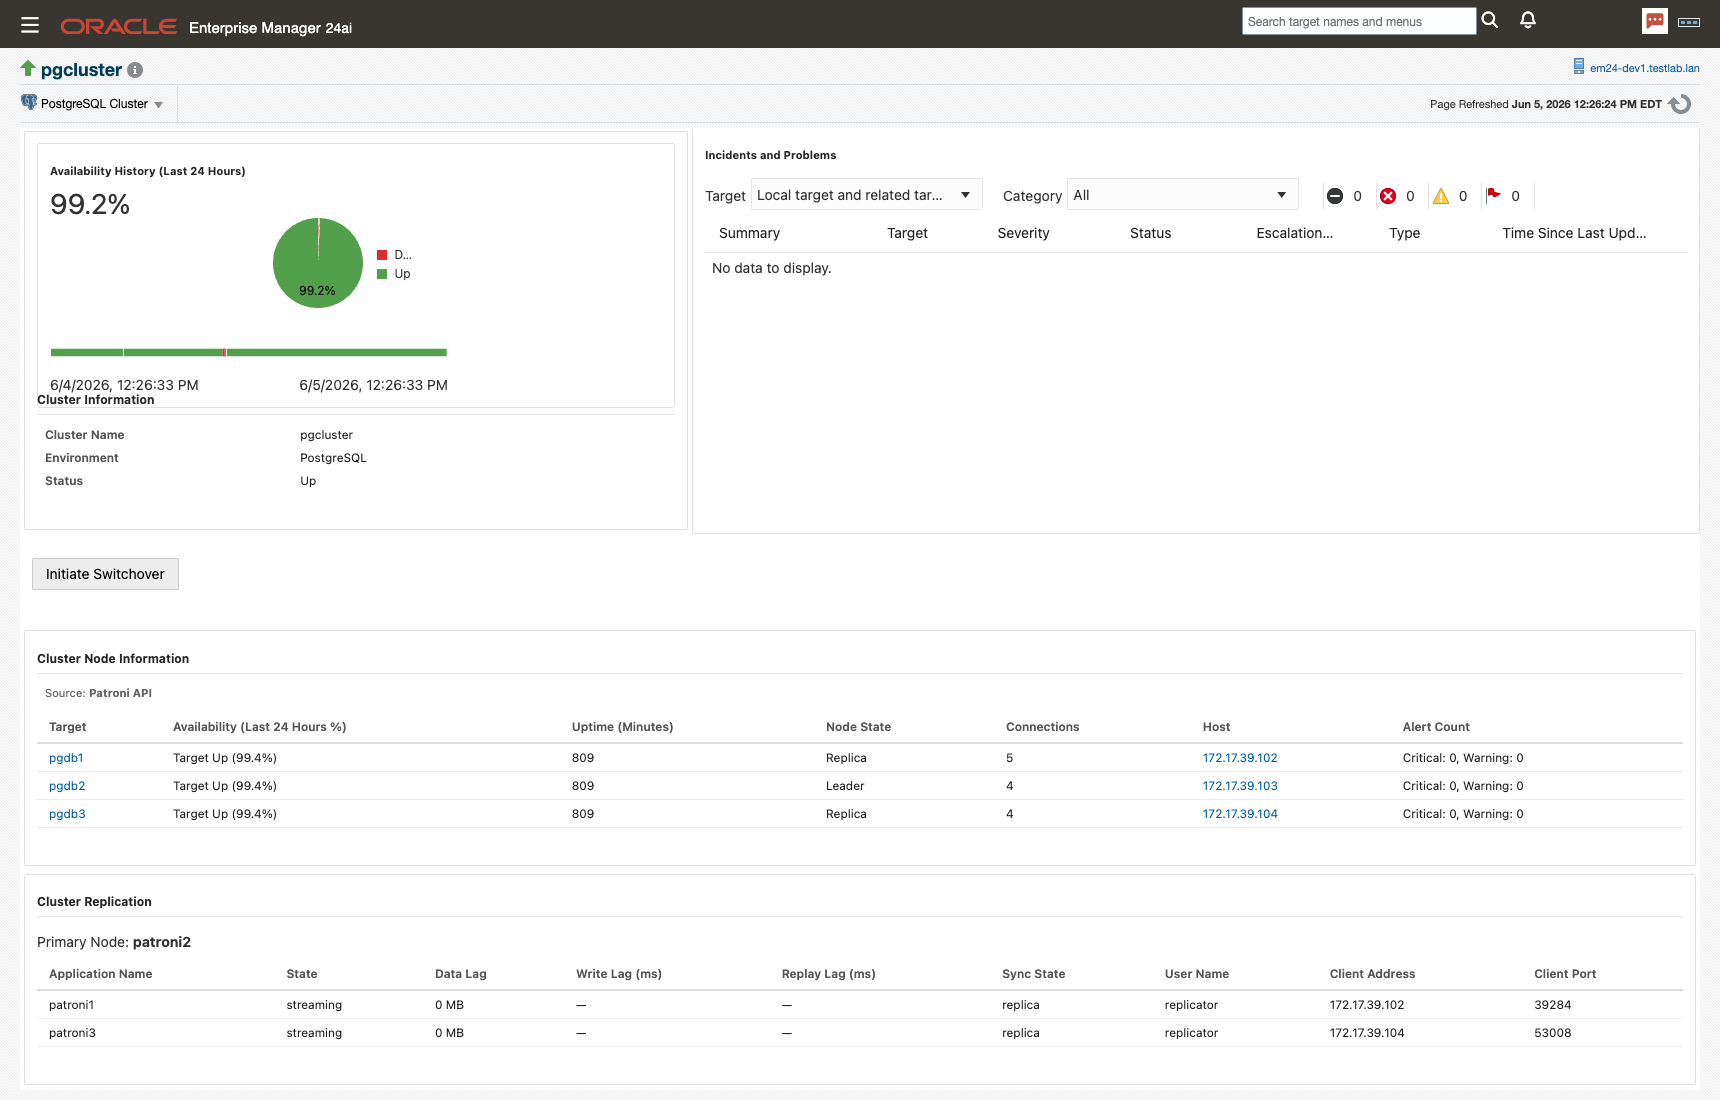
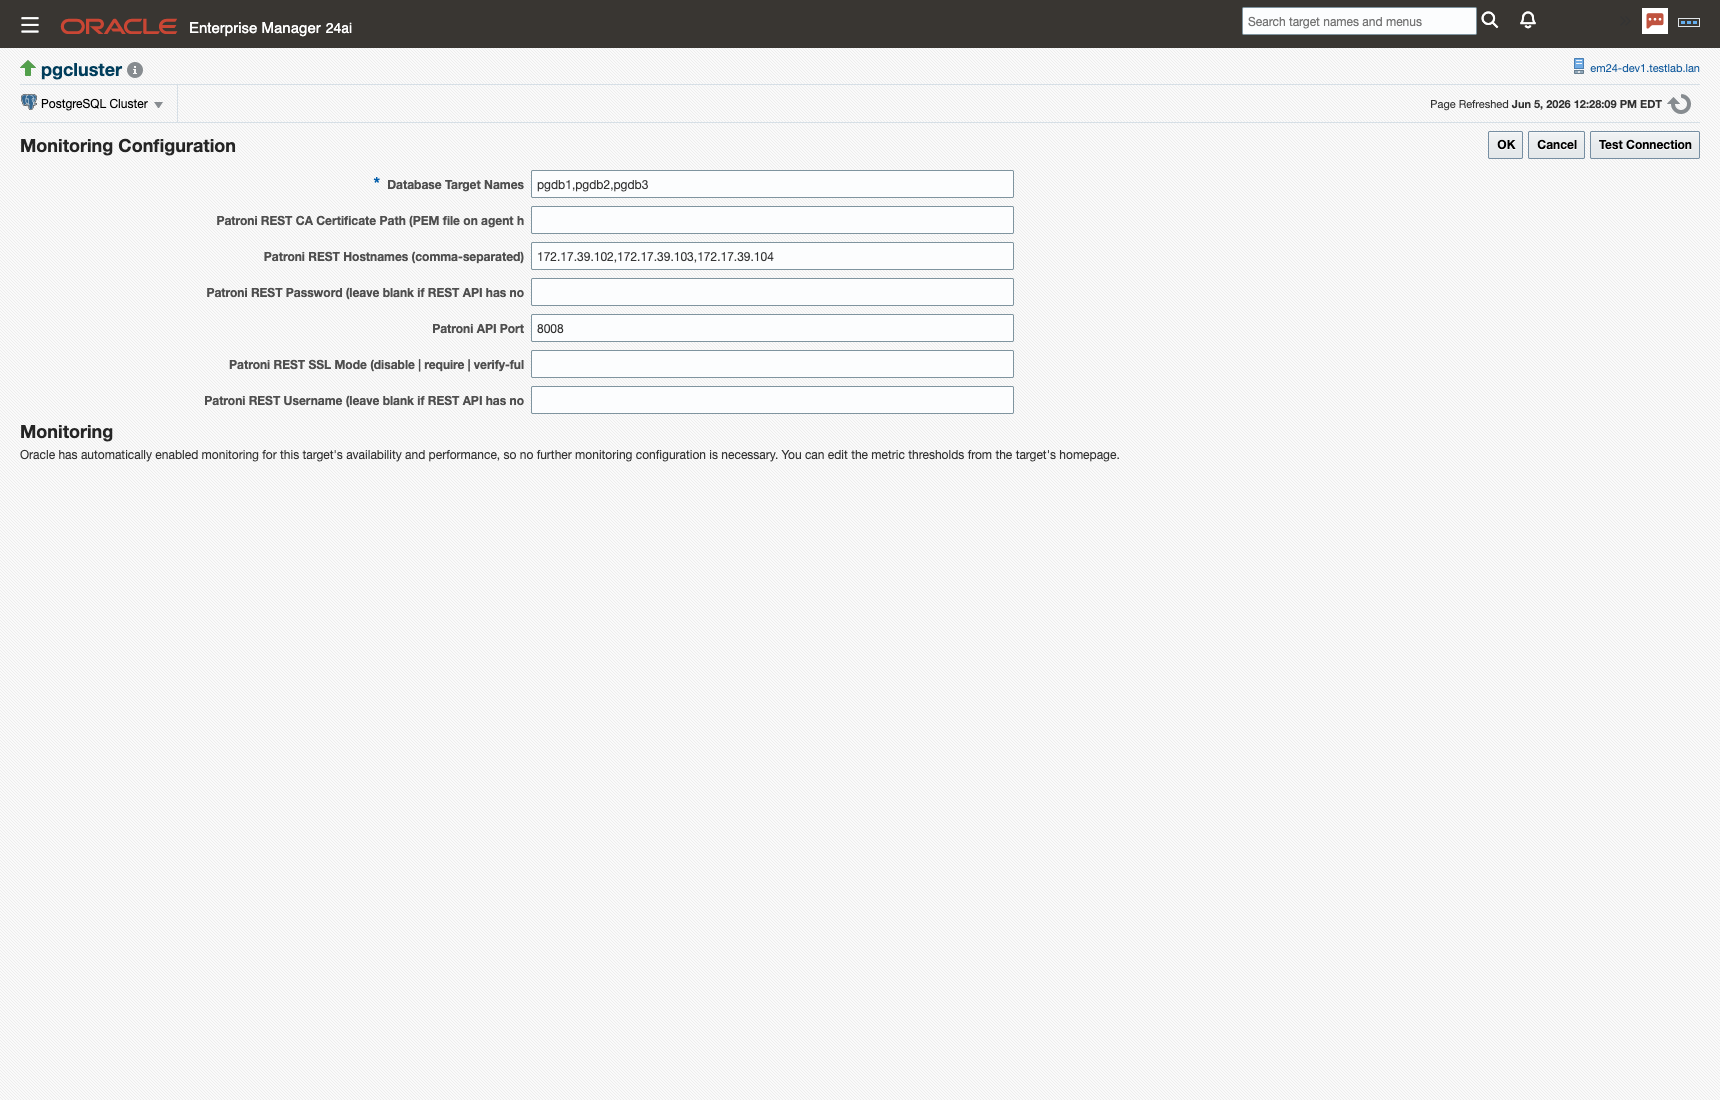
Patroni already has the answer: its REST API reports cluster state from every member, not just the leader. As of 13.5.12, the plug-in can use it as a monitoring source. Enable it with a single target property, and the plug-in will query the Patroni /cluster endpoint for topology, member roles, and replication state. If one cluster member doesn't respond, it tries the next until it gets an answer. A failed primary stops being a blind spot; it becomes a data point on your cluster home page.
The REST connection supports the security setups we actually see in customer environments:
- Three TLS modes —
disable(plain HTTP),require(HTTPS), andverify-full(HTTPS with full certificate and hostname verification) - Custom CA support — point the plug-in at your internal CA certificate for
verify-fullagainst self-signed or internally issued Patroni certs - Optional HTTP Basic authentication — for Patroni endpoints that require credentials
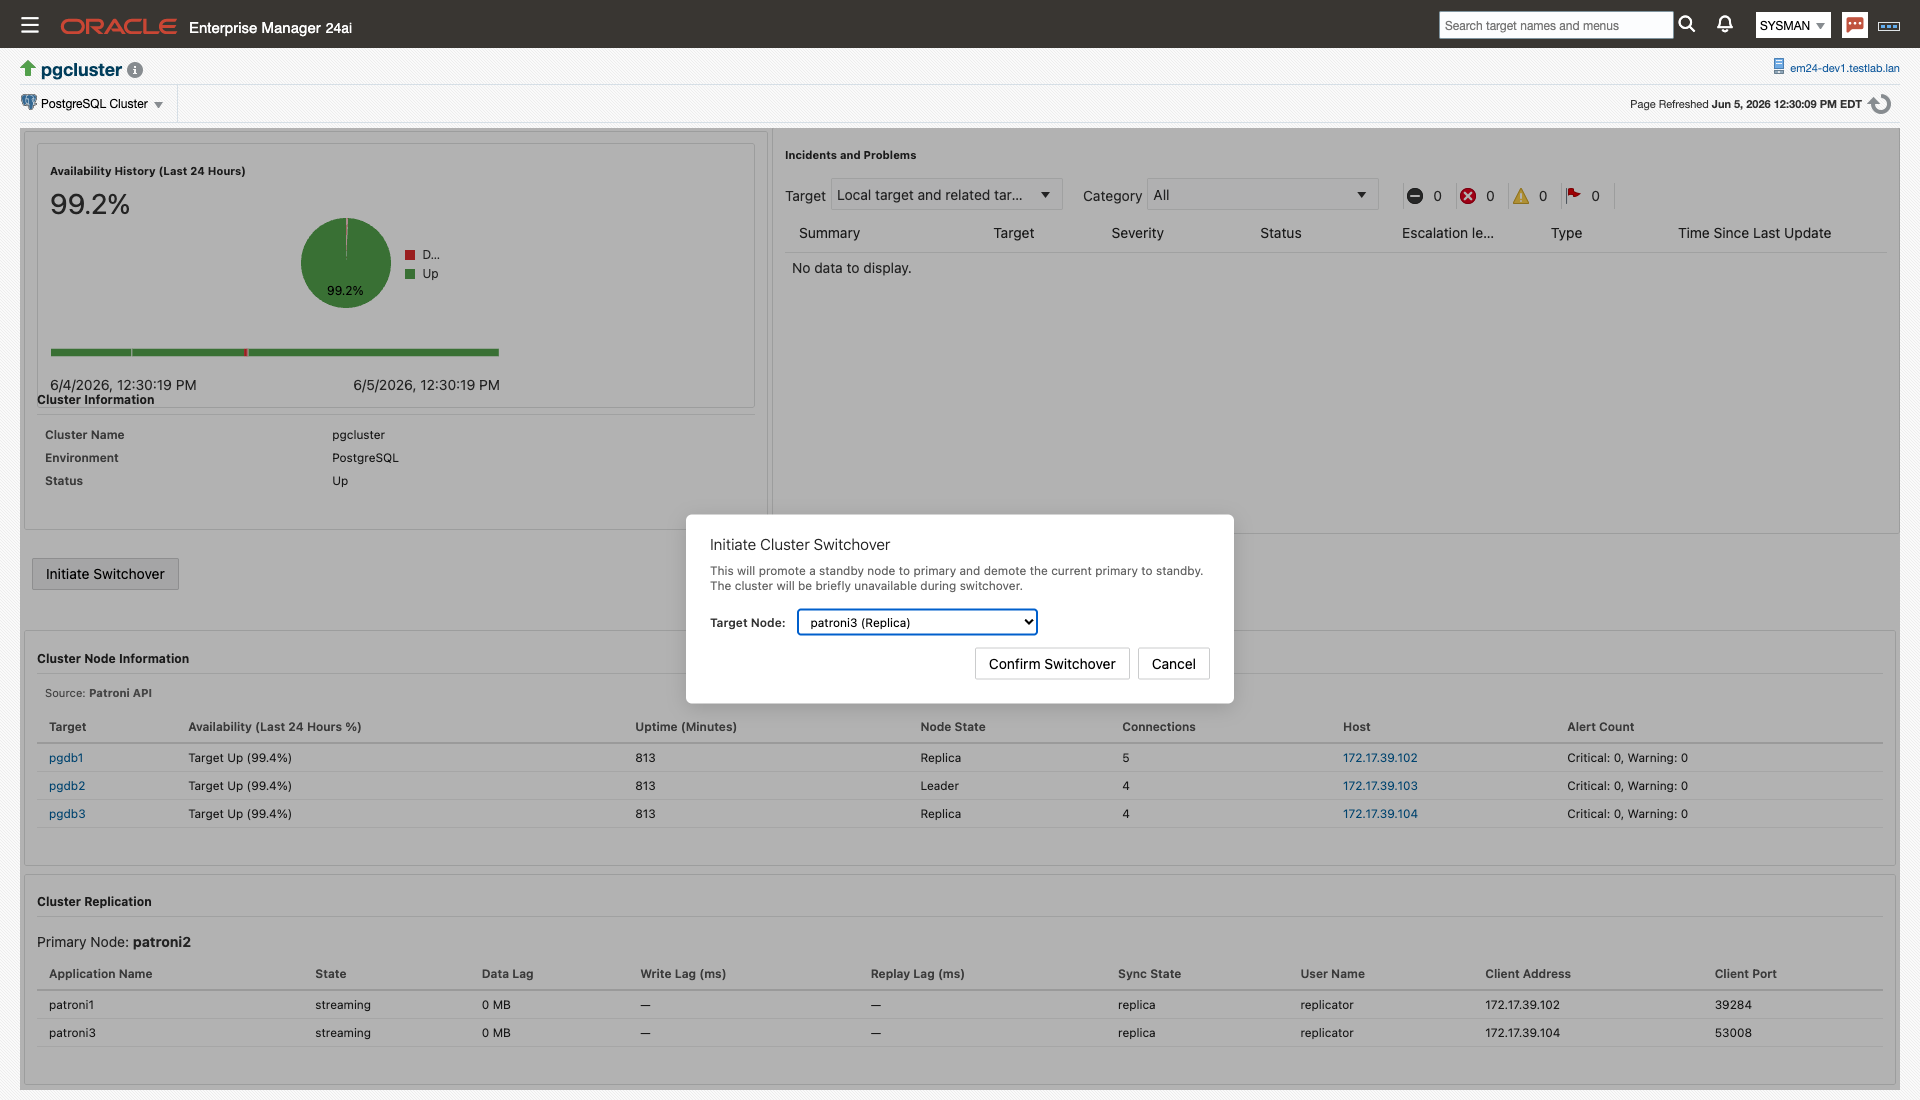
This pairs with the one-click Patroni switchover we shipped in an earlier release. Together they close the loop: you can watch a Patroni cluster and, when the time comes, trigger a switchover and pick the candidate node without leaving Enterprise Manager.
Also in 13.5.12
The Patroni work is the headline, but the release carries a full set of improvements:
- Four new schema-inventory metrics — Triggers, Prepared Transactions, Sequences, and User Functions join the existing schema inventory
- JET 14 and JET 18 (Redwood) compatibility — the plug-in UI is ready for the latest Oracle Enterprise Manager releases, including the Redwood interface
- Security updates — hardened UI rendering and updated dependencies, including the latest log4j
- Job reliability fix — Backup, Restore, Switchover, and Custom Query jobs now correctly propagate failures, so a failed job shows as Failed in OEM instead of silently succeeding
- Stability fixes — resolved an intermittent
MetricGetExceptionon the SQL Statements, Blocked Queries, and Idle Connections pages under active workload, fixed the Tables and Indexes filter controls, and suppressed transient error dialogs when a target is down
That last group came largely from customer reports. If you filed one of those tickets, thank you. This release is better because of you.
Getting the Update
New to the plug-in? It brings roughly 200 PostgreSQL metrics, pre-built dashboards, alerts, and now full Patroni cluster awareness into the Oracle Enterprise Manager console your team already knows.
The short version: as of 13.5.12, your PostgreSQL cluster monitoring no longer shares a fate with your primary. For the teams running Patroni behind Oracle Enterprise Manager, that's one less thing to worry about at 2 a.m.
Do I have to reconfigure my existing cluster targets after upgrading to 13.5.12?+
No. REST collection is off by default. After the upgrade, existing cluster targets keep using the SQL-based path until you set use_patroni_api_for_metrics to true and fill in the Patroni hostnames. You can enable it one cluster at a time.
What happens when a Patroni member doesn't respond to the plug-in?+
The plug-in walks your configured host list in order and uses the first member that answers. Since every Patroni member can report state for the whole cluster, monitoring keeps working as long as at least one member is reachable. That's the point of the feature: the death of the primary doesn't take your visibility down with it.
Does the plug-in need credentials to talk to the Patroni REST API?+
Only if your Patroni endpoints require them. Many clusters run the REST API unauthenticated on an internal network, and in that case you leave the username and password fields blank. If your endpoints sit behind HTTP Basic authentication, enter the credentials in the target's Monitoring Configuration page. TLS is configured separately through the SSL mode property.
We issue our own certificates internally. Can the plug-in still verify them?+
Yes. Set the SSL mode to verify-full and point the CA certificate path at a PEM file on the agent host containing your internal CA. The plug-in then verifies both the certificate chain and the hostname, the same checks a browser would do.
Which Enterprise Manager versions does 13.5.12 support?+
Enterprise Manager 13.5 and Enterprise Manager 24ai. The UI works on both JET 14 and JET 18, which means it renders correctly in the Redwood interface that ships with the latest EM releases.
How do I get the update?+
Email helpdesk@integrationplumbers.io. We'll send you access details for the 13.5.12 package along with upgrade guidance for your environment. The upgrade itself follows the standard Enterprise Manager plug-in lifecycle: deploy on the management server first, then on the agents.


