For years, the story of observability was straightforward: instrument your services, ship the telemetry to a backend, and hope the dashboard tells you why production broke. The current wave of AI is rewriting that story—but not in the way most vendor announcements suggest. The interesting change is not simply adding a chatbot to a dashboard. It is the emergence of a feedback loop in which software becomes easier to instrument, complex AI workflows become traceable, and agents help engineers investigate what went wrong. Three developments illustrate each side of that loop, and Jaeger 2.0 offers a useful starting point for understanding the shift.
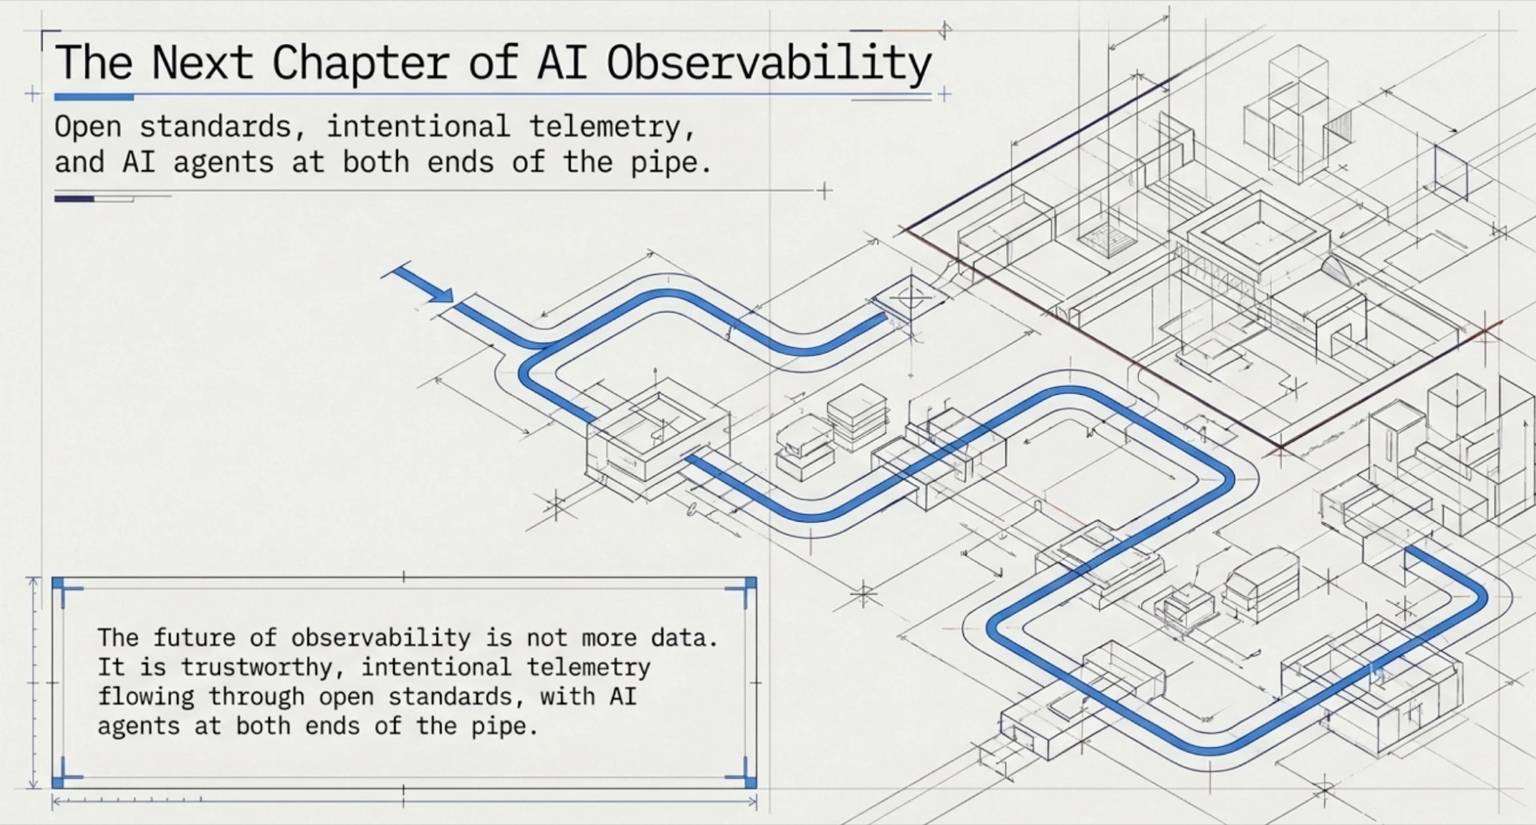
Bottom line: the future of observability is not more data, and it is not a chatbot bolted onto a dashboard. It is trustworthy, intentional telemetry flowing through open standards, with AI agents at both ends of the pipe—helping write the instrumentation and helping read the results. Jaeger does not do every AI-observability job, but its architecture puts an open standard underneath that loop.
We will cover this in six parts:
- Why Jaeger's rebuild matters
- Why AI workloads change the picture
- The instrumentation problem
- The investigation problem
- Jaeger's next chapter
- How the three links form one loop
1. Why Jaeger's rebuild matters
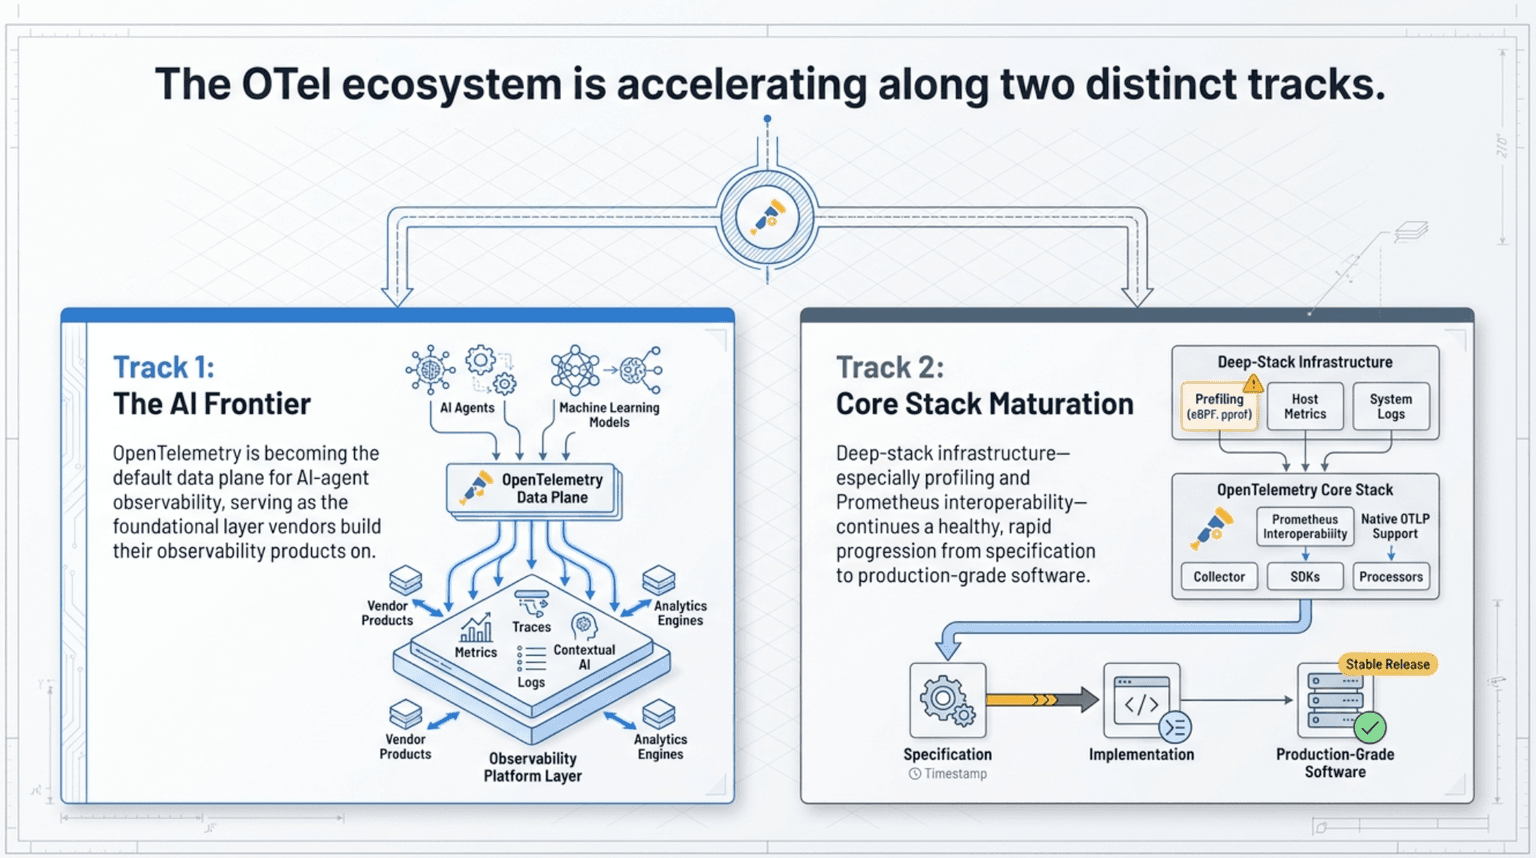
When the Jaeger project rebuilt itself as version 2, it did something more consequential than a version bump. Jaeger v2 is built on the OpenTelemetry Collector, inheriting its extensible pipeline and ecosystem of receivers, processors, and exporters (CNCF blog). The project describes the result as natively understanding the OpenTelemetry Protocol end to end, "eliminating the need for translation layers and improving performance" (CNCF blog).
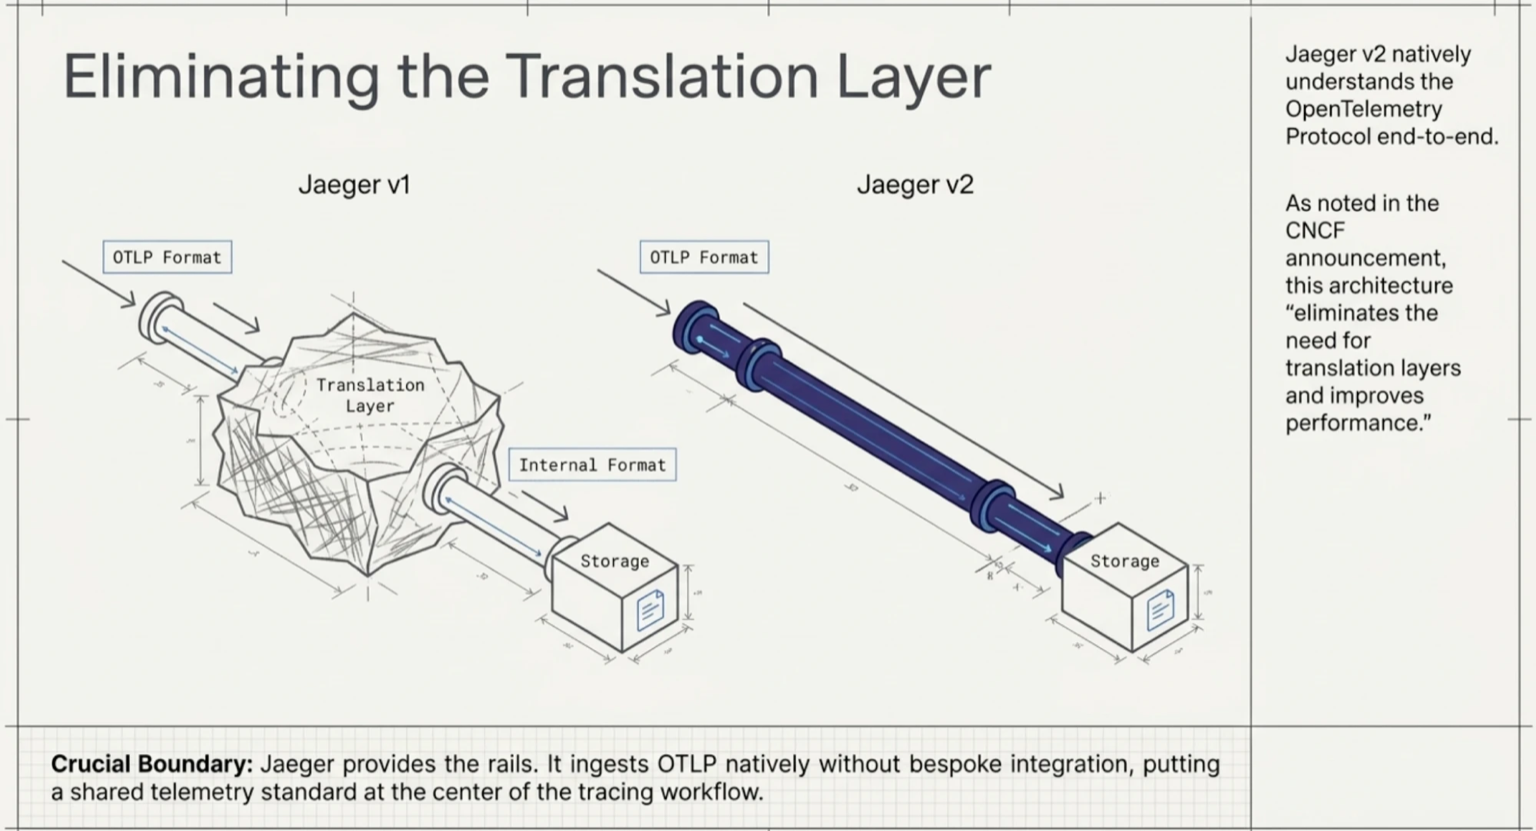
That plumbing decision is why Jaeger deserves center stage in this story. By adopting OpenTelemetry at its core rather than treating it as an input format, Jaeger turned itself from a standalone tracer into a citizen of a shared telemetry ecosystem—one where instrumentation libraries, collectors, and backends all speak the same protocol. In an era of AI workloads, that convergence matters more than ever.
2. Why AI workloads change the picture
AI applications add new ingredients—model calls, tool invocations, and orchestration steps—to familiar distributed-system challenges. Following a user prompt through agent planning, model calls, tool use, and branching logic to a final response takes what any distributed trace takes: context propagation, and agreed names for each step. Without them, those steps remain opaque black boxes.
That agreement is arriving through the OpenTelemetry GenAI semantic conventions. They define model spans for individual inference calls, carrying the model name and token usage (gen_ai.usage.input_tokens and gen_ai.usage.output_tokens); agent spans for creating and invoking agents, including a span for an agent's planning or task-decomposition phase; and an execute_tool span for each tool call (GenAI spans, agent spans). Prompt and response content can be recorded as well, but only when you opt in, because it is likely to contain sensitive data (client inference). The conventions are still in development, but their direction of travel is clear: the same signals engineers use for ordinary services—spans, attributes, context—extended to describe AI behavior.
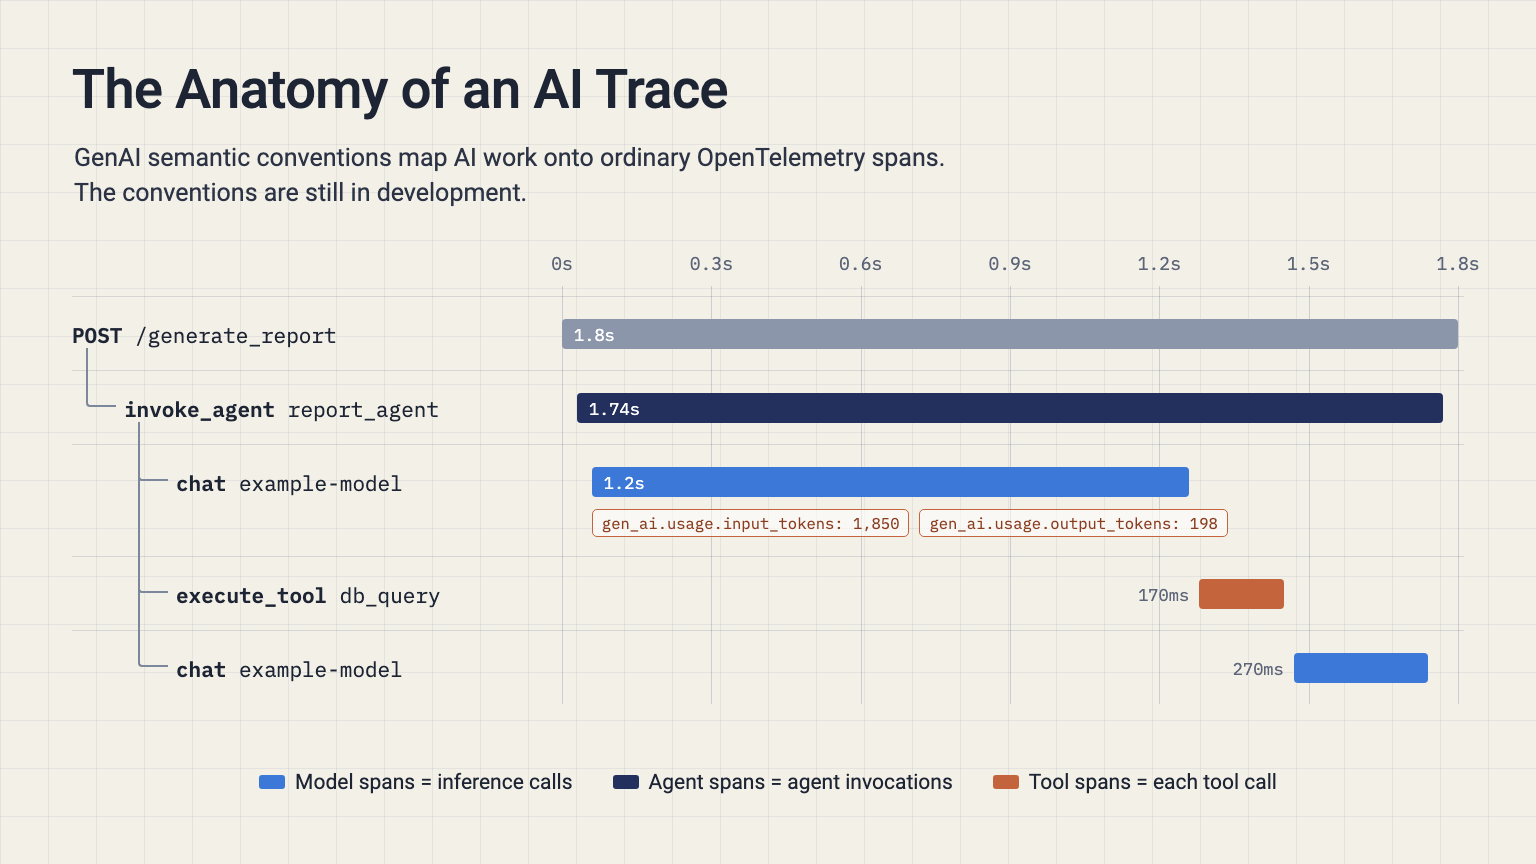
Here is where Jaeger's architecture pays off: when applications emit GenAI spans over OTLP, Jaeger v2 receives them like any other trace, because it ingests OTLP natively, without a translation layer or a bespoke integration (CNCF blog). To be clear about the boundary: Jaeger does not generate that instrumentation, and the GenAI-specific analysis discussed below is on Jaeger's roadmap, not in a release (Jaeger roadmap). It provides the rails. The significance is interoperability, not exclusivity: Jaeger's architecture puts a shared telemetry standard at the center of the tracing workflow.
3. The instrumentation problem: less, but better
The loop's first link is getting good telemetry in the first place, and this is where one of the newest entrants in the landscape fits. OllyGarden's Rose is an AI agent that works on source-code repositories: it adds missing OpenTelemetry instrumentation, expands coverage in services that are already instrumented, and moves vendor-specific instrumentation to OpenTelemetry. Every change arrives as a pull request for your team to review—Rose never merges or writes to the default branch (OllyGarden product page).
Its Minimum Viable Instrumentation (MVI) capability, introduced in October (Tech.eu), is a quiet manifesto against telemetry maximalism. For a repository with no instrumentation, Rose builds an OpenTelemetry baseline that combines zero-code instrumentation with business context—the checkout outcome, the payment method, the number of items in the cart—rather than drowning backends in spans nobody reads. In the company's own words: "The difference is one span and its attributes, not a hundred more spans" (OllyGarden product page).
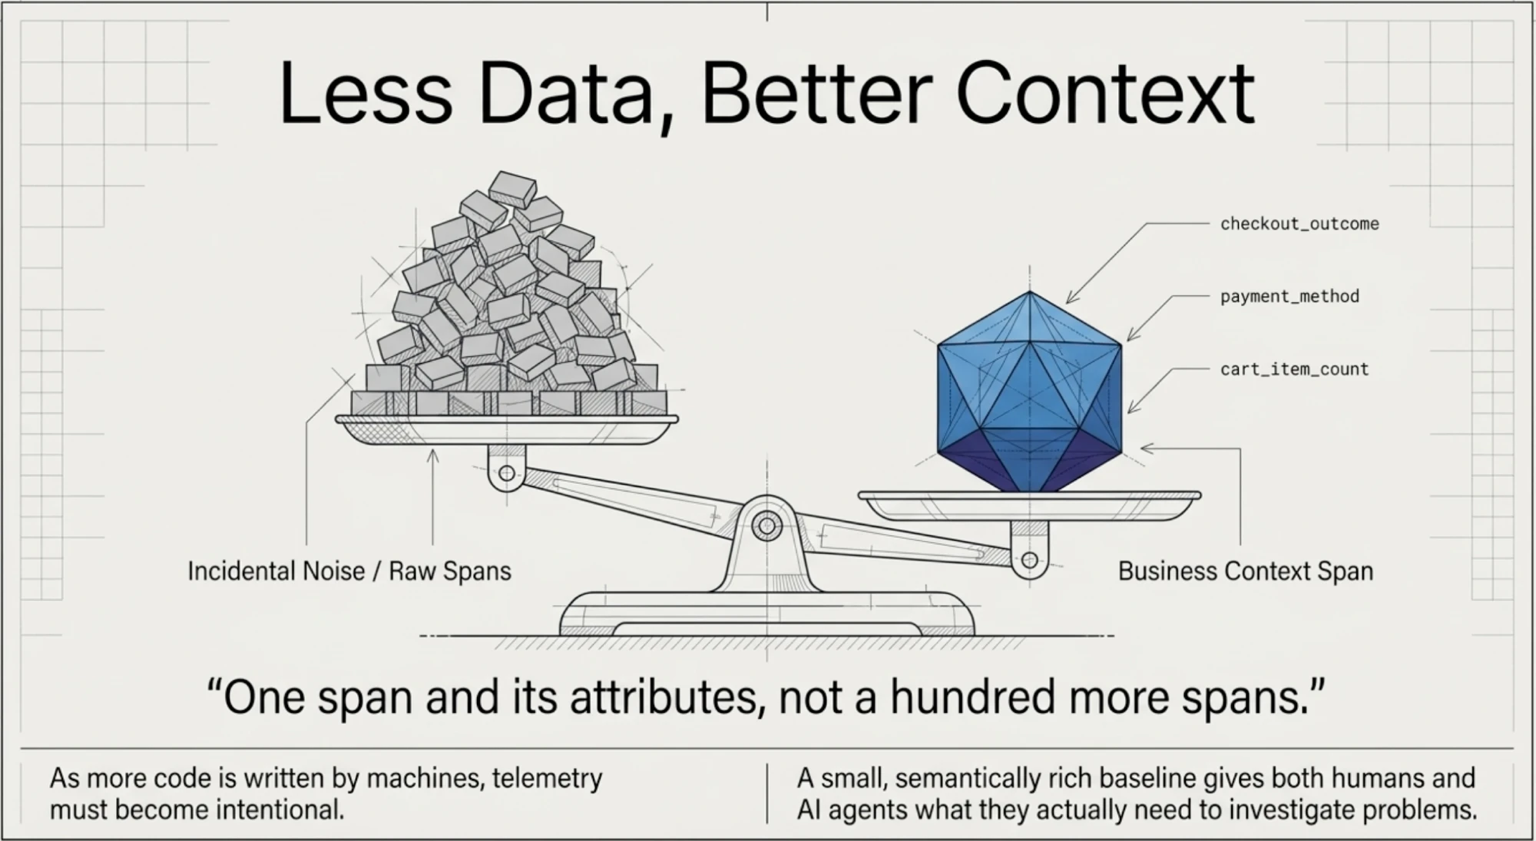
This is a meaningful philosophical shift: a small, semantically rich baseline gives both humans and AI agents what they actually need to investigate problems. As more code is written by machines, the argument goes, the telemetry describing that code must become intentional rather than incidental.
4. The investigation problem: agents on shift
The loop's far end is making sense of the telemetry once it arrives. In November 2025, Observe, Inc.—now part of Snowflake—introduced two agents that split this work into two roles. Its AI SRE agent applies context from logs, metrics, and traces to automate incident investigation, pinpoint root causes, and suggest fixes, and engineers can ask it questions in natural language from their code editor. Its o11y.ai agent lets developers generate OpenTelemetry instrumentation, debug, and validate fixes using context from their telemetry and code (PR Newswire).
The important question for any investigation agent is how it grounds its conclusions. Observe describes drawing on context across logs, metrics, and traces to investigate incidents and suggest fixes—structured, correlated signals of the kind that OpenTelemetry-based pipelines exist to produce. An AI SRE is only as good as the telemetry it can query, which loops back to everything else in this story.
5. Jaeger's next chapter
Jaeger's own roadmap shows where the loop closes. It lists four GenAI integrations "with increasing order of complexity": a free-form question about a single trace, automated analysis of a trace, a free-form search query, and free-form investigation by an AI agent. It also states that Jaeger "will evolve beyond traditional distributed tracing to become the observability backbone for GenAI applications": natively handling large, multi-modal payloads with tiered storage and PII sanitization, serving as a registry for evaluation outcomes so quality metrics are traceable to specific agentic steps, and extending the query language to filter on quality scores and user feedback (Jaeger roadmap).
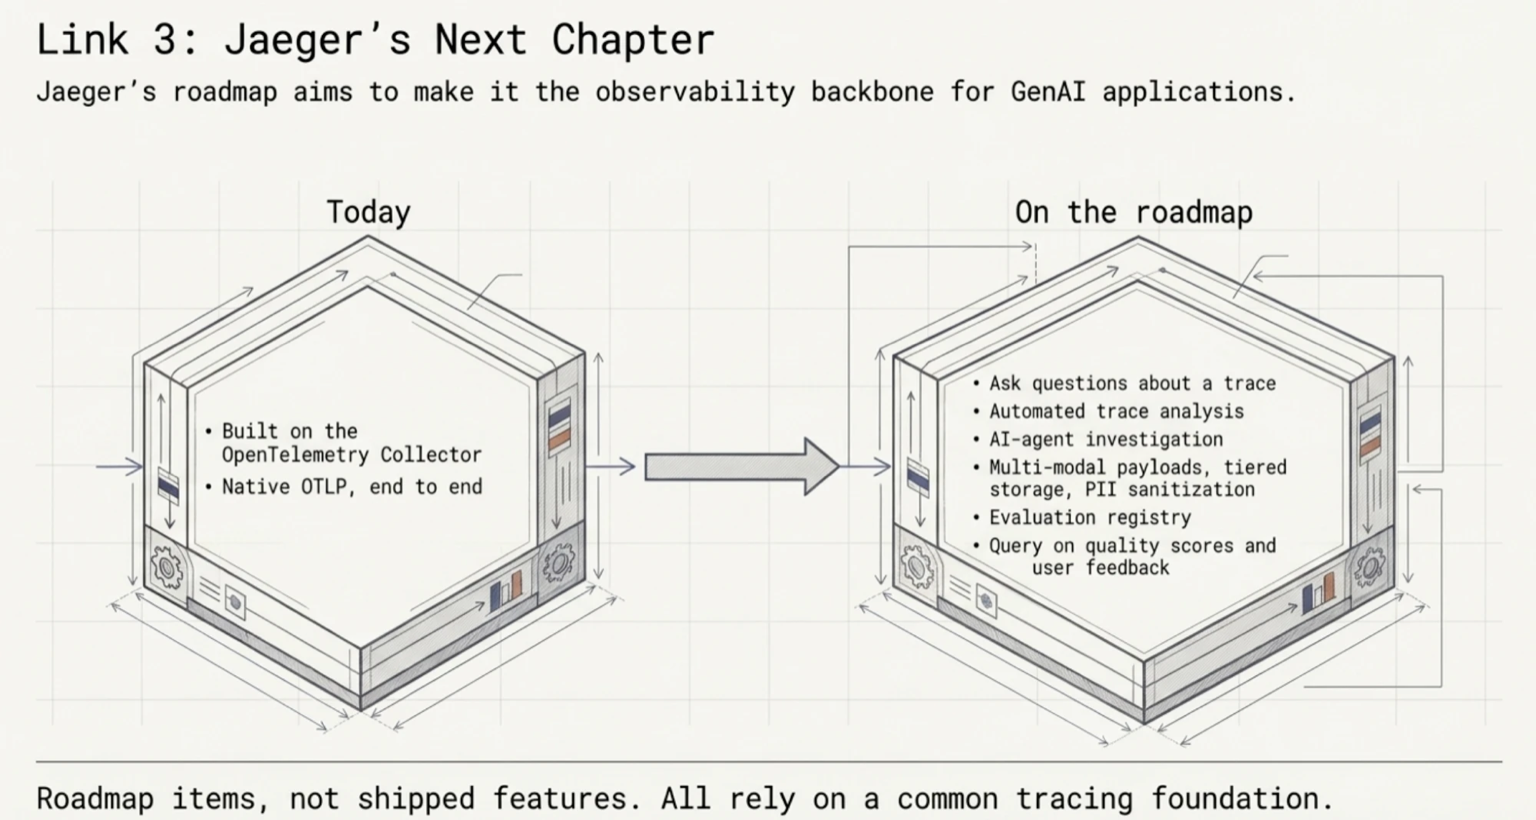
Those are ambitions, not shipped features, and it is worth keeping the two distinct. But notice the shape: every one of those roadmap items strengthens the case for a common tracing foundation that can accommodate richer AI workflows.
6. One loop, three links
Put together, the pattern is a feedback loop rather than a feature race. Rose improves instrumentation at the source so that telemetry carries business context instead of noise (OllyGarden product page). Jaeger v2 provides the open, OTLP-native backbone that can carry both conventional services and GenAI pipelines (CNCF blog). Investigation agents such as Observe's AI SRE close the loop by working through telemetry and suggesting fixes—and o11y.ai can generate the very instrumentation the loop depends on (PR Newswire).
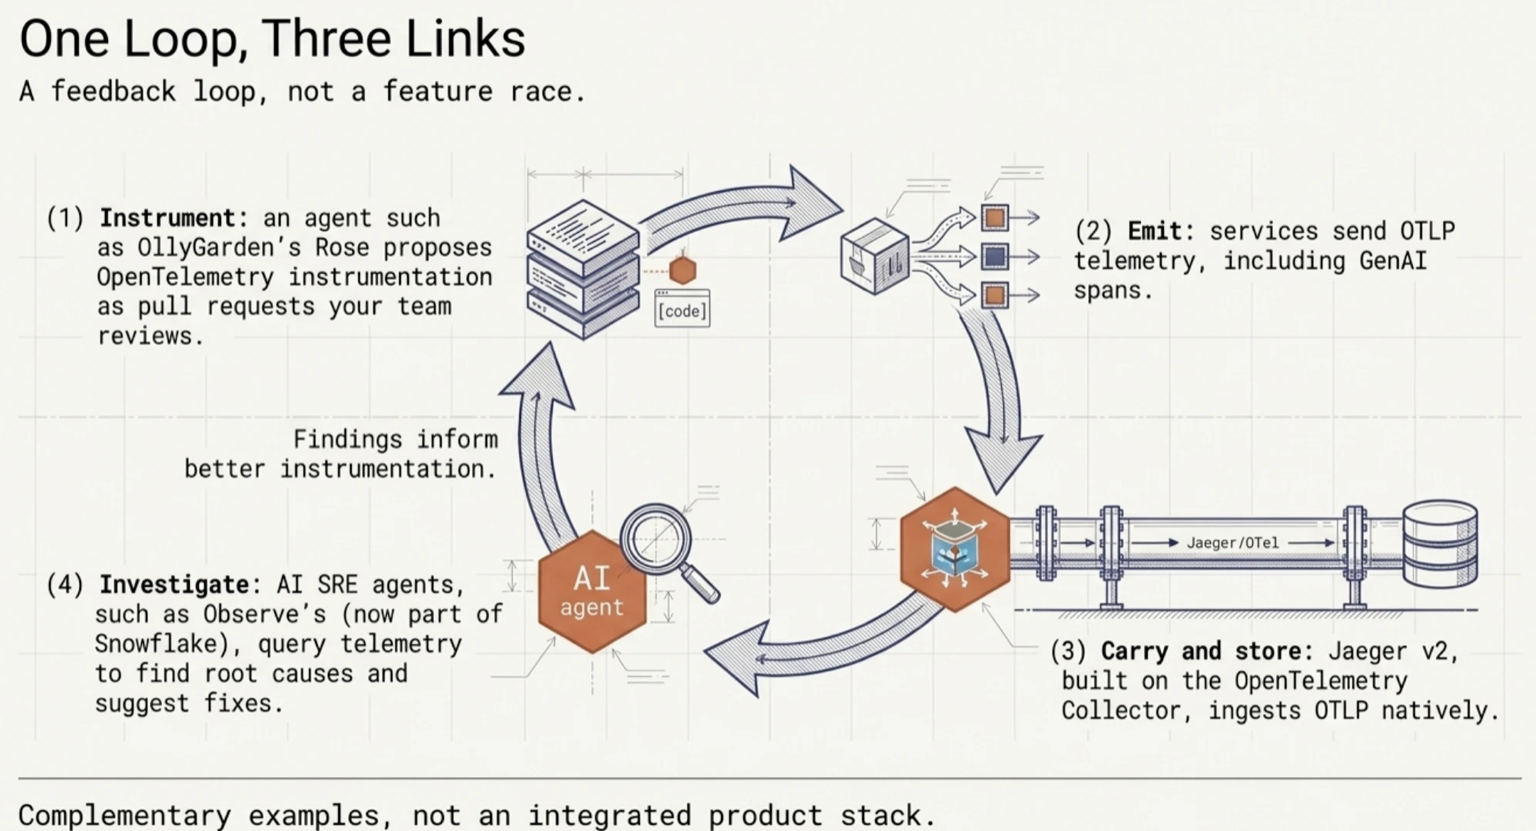
These are complementary examples, not a verified integration or a proposed three-product stack. But they converge on the same conclusion from three different directions: the future of observability is not more data, and it is not a chatbot bolted onto a dashboard. It is trustworthy, intentional telemetry flowing through open standards, with AI agents at both ends of the pipe—writing the instrumentation and reading the results. This is the case for putting Jaeger at the front of the story: not that it does every AI-observability job, but that its architecture puts open standards underneath the feedback loop. In the AI era, that may be the most defensible position of all.
What changed in Jaeger v2?+
Jaeger v2 is rebuilt on the OpenTelemetry Collector, so it inherits the Collector's receivers, processors, and exporters and understands the OpenTelemetry Protocol (OTLP) end to end. The project says this removes the translation layers Jaeger v1 needed and improves performance.
Can Jaeger store traces from AI applications?+
Yes, if the application sends them over OTLP. Spans that follow the GenAI semantic conventions arrive like any other spans, with their attributes. Jaeger does not create that instrumentation, and GenAI-specific analysis in Jaeger, such as asking questions about a trace or agent-driven investigation, is on the project's roadmap rather than in a release.
Are the OpenTelemetry GenAI semantic conventions stable?+
No. They are marked as in development, so span and attribute names can still change. They currently define model spans for inference calls, agent spans for creating and invoking agents, and execute_tool spans for tool calls.
What is Minimum Viable Instrumentation?+
It is OllyGarden's approach for repositories with no instrumentation: Rose builds an OpenTelemetry baseline that combines zero-code instrumentation with a small set of business attributes, such as the checkout outcome, the payment method, and the number of items in the cart. Changes arrive as pull requests for your team to review.
Do Rose, Jaeger, and Observe's agents work together?+
Not as a product. They are independent examples of three parts of the same loop—writing instrumentation, carrying and storing telemetry, and investigating it—not a tested integration or a recommended stack.