1. Introduction: The Sticker Shock Moment
You’ve done everything right. Your team has migrated from proprietary agents to OpenTelemetry. The instrumentation is working beautifully—traces are flowing, metrics are populating dashboards, and your SREs are finally getting the visibility they’ve been asking for.
Then the bill arrives.
Your Prometheus instance is consuming 400% more memory than projected. Grafana queries that should return in milliseconds are timing out. Your cloud observability vendor sends a polite email asking if you’d like to “discuss your usage patterns.”
The problem isn’t the volume of requests your application is handling. Traffic is exactly where you predicted. The culprit is something more insidious: high cardinality.
High cardinality isn’t just about how much data you’re collecting—it’s about how diverse that data is. When every request generates a unique combination of attribute values, you create a combinatorial explosion that degrades performance and skyrockets costs.
In this post, we’ll use a fictional case study—SparkPlug Motors—to show you how to identify high cardinality problems and, more importantly, how to fix them using the OpenTelemetry Collector. We’ll cover governance strategies for enterprise teams and provide you with practical approaches to apply immediately.
Key Terms (Click to expand)
Cardinality: The number of unique values or combinations in a dataset. High cardinality means millions of unique values; low cardinality means a small, predictable set.
OpenTelemetry Collector: A vendor-agnostic data pipeline that receives, processes, and exports telemetry data (metrics, traces, logs).
Metric Stream: A unique time-series created by a distinct combination of metric name and label values in time-series databases like Prometheus.
Semantic Conventions: Standardized attribute naming patterns defined by the OpenTelemetry project to ensure consistency across implementations.
Transform Processor: An OTel Collector component that modifies telemetry data in-flight, such as dropping attributes or aggregating values.
2. What is Cardinality? (The LEGO Analogy)
Before we dive into solutions, let’s establish a mental model.
Low Cardinality: The LEGO Kit
Imagine you’ve purchased a LEGO Millennium Falcon kit. The box contains exactly 7,541 pieces organized into numbered bags. Each bag has a specific purpose, and the instruction manual tells you precisely where each piece goes. This is low cardinality—structured, predictable, and easy to manage.
In observability terms, a low-cardinality attribute is something like order_status:
# Low cardinality example
order_status = ["pending", "processing", "shipped", "delivered", "cancelled"]
# Only 5 possible values across millions of orders
Your metrics system can easily index these five values. When you query “show me average checkout latency by order_status,” your database can efficiently group and aggregate.
High Cardinality: The Mixed LEGO Pile
Now imagine someone dumped fifty different LEGO sets into a giant bin, removed all the bags and instructions, and mixed everything together. Finding the right piece becomes exponentially harder. This is high cardinality—chaotic, unpredictable, and expensive to query.
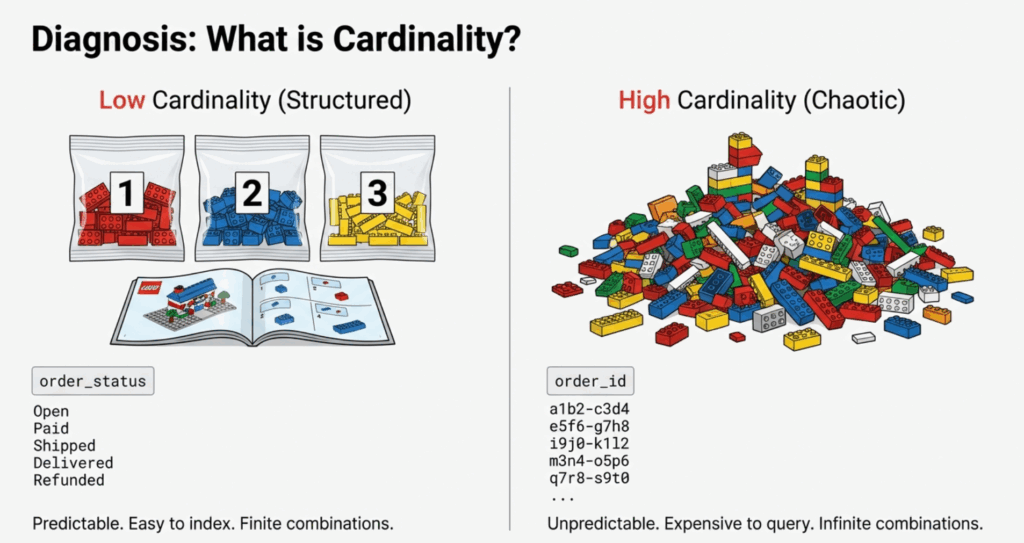
In observability, high-cardinality attributes generate unique values for every request:
# High cardinality example
order_id = "ORD-8f4e3a21-9b7c-4d1e-a5f6-2c8b9e3d7a1f"
user_id  = "USR-7c2d8e9f-3a1b-4c5e-9f6a-8d2e3b7c1a4f"
container_id = "k8s-pod-checkout-svc-7f9d8c3e2b1a-5g6h7"
# Millions of unique values across millions of requests
The Technical Impact
Time-series databases like Prometheus create a unique metric stream for every distinct combination of label values. Consider this metric:
http_request_duration_seconds{method="POST", endpoint="/checkout", order_id="ORD-12345"}If you have:
- 5 HTTP methods
- 20 endpoints
- 1,000,000 unique order IDs per day
You’re not creating 100 metric streams (5 × 20). You’re creating 100,000,000 streams (5 × 20 × 1,000,000).
Each stream requires:
- Index space in memory
- Storage for time-series data points
- Computation overhead for queries that must scan millions of streams
This is why your Prometheus instance chews through memory, and why your observability vendor is sending concerned emails.
3. Case Study: The “SparkPlug Motors” Mistake
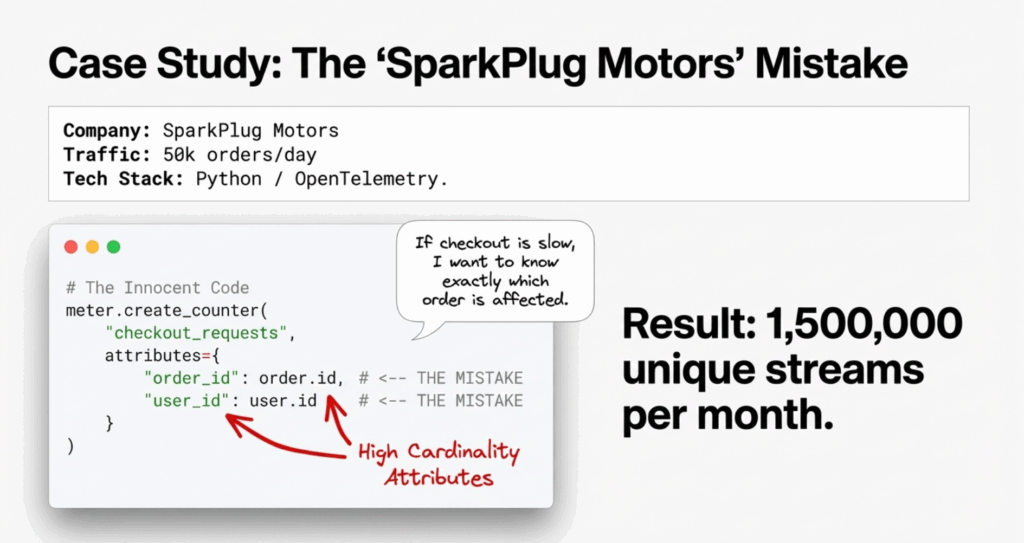
Let me introduce you to SparkPlug Motors, a fictional but representative auto parts e-commerce company.
The Scenario
SparkPlug Motors had recently adopted OpenTelemetry for their checkout microservice. The platform team provided a Python SDK wrapper that application developers could use to instrument their code. One enthusiastic developer, trying to get maximum visibility into checkout performance, wrote this:
from opentelemetry import metrics
from opentelemetry.sdk.metrics import MeterProvider
from opentelemetry.sdk.metrics.export import PeriodicExportingMetricReader

# Application code
meter = metrics.get_meter(__name__)
checkout_latency = meter.create_histogram(
    name="checkout.duration",
    description="Time to process checkout",
    unit="ms"
)

def process_checkout(order_id, user_id, items):
    start_time = time.time()

    # Business logic here
    result = perform_checkout(order_id, user_id, items)

    duration = (time.time() - start_time) * 1000

    # THE MISTAKE: Adding unique IDs as attributes
    checkout_latency.record(
        duration,
        attributes={
            "order_id": order_id,        # UNIQUE per request
            "user_id": user_id,           # UNIQUE per user
            "order_status": result.status # LOW cardinality (5 values)
        }
    )

    return result
The Mistake
The developer added order_id and user_id as metric attributes. Their reasoning was sound: “If checkout is slow for a specific order, I want to know which order!”
But here’s what actually happened:
- SparkPlug processes ~50,000 orders per day
- Each order has a unique order_id
- They have ~10,000 active users per day
- Metric retention is set to 30 days
Cardinality explosion:
- Instead of ~5 metric streams (one per order_status)
- They created ~1,500,000 unique streams per month
- Each stream stored 1,440 data points per day (1-minute resolution)
The Consequence
Within two weeks:
- Prometheus memory usage increased by 600% and began OOM-killing
- Grafana queries timing out when attempting to visualize P95 latency
- Monthly observability costs increased by $8,000 (from $2K to $10K)
- SRE team couldn’t actually use the data because aggregations were too slow
The cruel irony? Nobody ever queried by order_id. The attribute that caused all this pain was never actually used for troubleshooting.
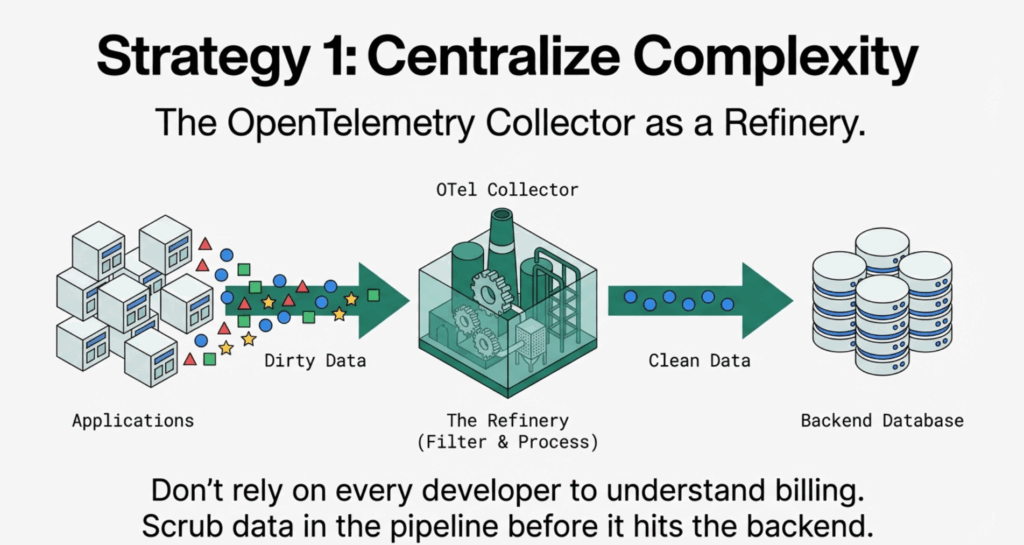
4. Strategy 1: Centralize Complexity in the Collector
The first lesson from SparkPlug’s experience: don’t trust every developer to make cardinality decisions.
This isn’t about developer competence—it’s about distribution of knowledge. In an enterprise with dozens of development teams, you can’t expect every engineer to understand the downstream cost implications of adding attributes to metrics.
The Solution: The OTel Collector as a Refinery
The OpenTelemetry Collector acts as a centralized data pipeline where your platform team can enforce governance policies. Instead of asking developers to remove high-cardinality attributes from their code (which requires coordination across multiple teams and codebases), you scrub the data before it reaches your expensive backends.
Here’s how SparkPlug’s platform team fixed the problem:
# otel-collector-config.yaml
receivers:
  otlp:
    protocols:
      grpc:
        endpoint: 0.0.0.0:4317
      http:
        endpoint: 0.0.0.0:4318

processors:
  # Drop high-cardinality attributes from metrics
  transform/drop_high_cardinality:
    error_mode: ignore
    metric_statements:
      - context: datapoint
        statements:
          # Remove order_id and user_id from all metrics
          - delete_key(attributes, "order_id")
          - delete_key(attributes, "user_id")
          # Keep business-critical low-cardinality attributes
          - keep_keys(attributes, ["order_status", "payment_method", "region"])

  # Batch for efficiency
  batch:
    timeout: 10s
    send_batch_size: 1024

exporters:
  prometheus:
    endpoint: "prometheus:9090"

  # For compliance/audit, send full-fidelity data to object storage
  file:
    path: /var/log/otel/high-cardinality-archive.json

service:
  pipelines:
    metrics:
      receivers: [otlp]
      processors: [transform/drop_high_cardinality, batch]
      exporters: [prometheus]

    # Separate pipeline for archival (if needed for compliance)
    metrics/archive:
      receivers: [otlp]
      processors: [batch]
      exporters: [file]
The Benefits
- No application code changes required – Developers keep their instrumentation
- Centralized governance – Platform team controls what reaches backends
- Flexibility – Can route different data to different destinations (real-time vs. archive)
- Fast iteration – Update collector config without redeploying applications
Enterprise Governance Tip
For organizations with multiple teams, create a collector configuration library with pre-approved processor templates:
configs/
├── processors/
│   ├── drop-pii.yaml
│   ├── drop-high-cardinality-ids.yaml
│   ├── standardize-attributes.yaml
│   └── aggregate-to-histograms.yaml
└── pipelines/
    ├── web-services.yaml
    ├── data-pipelines.yaml
    └── infrastructure.yaml
Teams can compose these building blocks while your platform team maintains the processor definitions.
5. Strategy 2: Aggregation and the “Inversion” Question
Sometimes you need high-cardinality data—but not in your metrics. This is where understanding the right tool for the right job becomes critical.
Aggregating to Histograms
Instead of storing every raw latency value with its unique order_id, convert that data into a histogram at collection time. You lose the ability to query by specific ID, but you retain the statistical insights you actually need.
Here’s how SparkPlug refactored their instrumentation:
from opentelemetry import metrics

meter = metrics.get_meter(__name__)

# Histogram automatically aggregates into buckets
checkout_latency = meter.create_histogram(
    name="checkout.duration",
    description="Time to process checkout",
    unit="ms"
)

def process_checkout(order_id, user_id, items):
    start_time = time.time()
    result = perform_checkout(order_id, user_id, items)
    duration = (time.time() - start_time) * 1000

    # FIXED: Only low-cardinality attributes
    checkout_latency.record(
        duration,
        attributes={
            "order_status": result.status,      # 5 values
            "payment_method": result.payment,   # 4 values
            "region": user.region               # 3 values
        }
    )

    # High-cardinality context goes to TRACES/LOGS, not metrics
    if duration > 5000:  # Slow checkout
        logger.warning(
            "Slow checkout detected",
            extra={
                "order_id": order_id,
                "user_id": user_id,
                "duration_ms": duration,
                "trace_id": current_span.get_span_context().trace_id
            }
        )

    return result
The “Inversion” Question
Here’s a powerful mental model for cardinality decisions. Instead of asking:
“What data might be useful?”
Ask:
“What data would be a show-stopper if missing?”
Apply this to SparkPlug’s scenario:
- Question: “Do I need to query checkout latency by order_id 30 days from now?”
- Reality Check: “No. If a specific order is slow, I’ll see it in real-time logs/traces. For trends and alerting, I need aggregated percentiles by status/region.”
- Question: “What if I need to debug why order #12345 was slow?”
- Answer: “That’s a trace/log query, not a metrics query. I’ll search traces by order_id for the specific timeframe.”
The Three Pillars Pattern
Modern observability has three distinct pillars, each with different cardinality tolerances:
| Pillar | Cardinality Tolerance | Retention | Use Case |
|---|---|---|---|
| Metrics | LOW (hundreds to low thousands of streams) | 30-90 days | Trends, dashboards, alerting |
| Traces | MEDIUM-HIGH (sampled) | 7-15 days | Request-level debugging |
| Logs | HIGH (indexed selectively) | 7-30 days | Text search, audit trails |
Key insight: order_id belongs in traces and logs, not metrics.
6. Strategy 3: Standardize with Semantic Conventions
One of the sneakiest sources of cardinality inflation is inconsistent naming conventions across teams.
The Wild West of Naming
In a large organization, different teams might instrument the same concept with different attribute names:
# Team A (E-commerce)
attributes = {"user_id": "12345"}

# Team B (Analytics)
attributes = {"userId": "12345"}

# Team C (Mobile)
attributes = {"uid": "12345"}

# Team D (Legacy migration)
attributes = {"customer_identifier": "12345"}
Even though these represent the same concept, your observability backend treats them as four separate dimensions. When you try to create a dashboard showing user behavior across all services, you can’t correlate the data without expensive joins or custom processing.
The Fix: OpenTelemetry Semantic Conventions
OpenTelemetry provides Semantic Conventions—standardized attribute names for common concepts. By adopting these across your organization, you ensure consistency.
Example: HTTP Server Instrumentation
// BAD: Custom attribute names
span.SetAttributes(
    attribute.String("request_method", "POST"),
    attribute.String("url", "/checkout"),
    attribute.String("client_ip", "192.168.1.1"),
    attribute.Int("response_code", 200),
)

// GOOD: Semantic conventions
import "go.opentelemetry.io/otel/semconv/v1.21.0"

span.SetAttributes(
    semconv.HTTPMethod("POST"),
    semconv.HTTPRoute("/checkout"),
    semconv.NetPeerIP("192.168.1.1"),
    semconv.HTTPStatusCode(200),
)
Enterprise Governance: The Attribute Registry
For SparkPlug Motors, the platform team created an internal attribute registry that extended OpenTelemetry semantic conventions with business-specific attributes:
# attribute-registry.yaml
version: "1.0"
namespaces:

  sparkplug.order:
    attributes:
      - name: sparkplug.order.status
        type: string
        cardinality: low
        allowed_values: [pending, processing, shipped, delivered, cancelled]
        description: "Current status of order"

      - name: sparkplug.order.payment_method
        type: string
        cardinality: low
        allowed_values: [credit_card, paypal, apple_pay, google_pay]
        description: "Payment method used"

  sparkplug.user:
    attributes:
      - name: sparkplug.user.region
        type: string
        cardinality: low
        allowed_values: [us-east, us-west, eu-central, apac]
        description: "User's geographical region"

      # High-cardinality - TRACES/LOGS ONLY
      - name: sparkplug.user.id
        type: string
        cardinality: high
        allowed_in: [traces, logs]
        forbidden_in: [metrics]
        description: "Unique user identifier - DO NOT use in metrics"
The platform team then:
- Published a code generator that created type-safe attribute helpers from this registry
- Configured the OTel Collector to validate/drop attributes not in the registry
- Integrated with CI/CD to flag violations during code review
// Generated code from attribute registry
package sparkplug

// Metrics-safe attributes (low cardinality)
func OrderStatus(value string) attribute.KeyValue {
    return attribute.String("sparkplug.order.status", value)
}

func PaymentMethod(value string) attribute.KeyValue {
    return attribute.String("sparkplug.order.payment_method", value)
}

// High-cardinality - compiler error if used with metrics
func UserID(value string) trace.Attribute {  // Note: trace.Attribute, not attribute.KeyValue
    return trace.String("sparkplug.user.id", value)
}
7. Real-World Results: SparkPlug’s Transformation

After implementing these three strategies over a six-week period, SparkPlug Motors achieved:
Cardinality Reduction:
- Before: 1.5M active metric streams
- After: 847 active metric streams
- Reduction: 99.94%
Performance Improvements:
- Prometheus memory usage: 18GB → 3.2GB (82% reduction)
- Grafana P95 query latency: 8.4s → 180ms (97% improvement)
- Dashboard load time: 45s → 2.1s (95% improvement)
Cost Savings:
- Monthly observability costs: $10,000 → $2,400 (76% reduction)
- Prevented need for Prometheus cluster expansion (saved $15K in infrastructure)
Developer Experience:
- Deployment velocity unchanged (no application code modifications required)
- Incident MTTR improved by 40% (dashboards actually usable during outages)
- Cross-team metric correlation now possible (semantic conventions)
Key Takeaways
- High-cardinality attributes (like order IDs or user IDs) create exponential growth in metric streams, leading to memory exhaustion and slow queries.
- The OpenTelemetry Collector centralizes governance, allowing platform teams to scrub high-cardinality data before it reaches expensive backends.
- Unique identifiers belong in traces and logs, not metrics—use histograms and low-cardinality attributes for aggregated insights.
- Semantic conventions prevent cardinality multiplication caused by inconsistent attribute naming across teams.
- Regular cardinality audits should be part of operational cadence to prevent cost creep and performance degradation.
8. Conclusion: Better Signal, Lower Bill
High cardinality gives you granular detail—but at a luxury price point. As we’ve seen with SparkPlug Motors, that detail is often noise rather than signal.
The uncomfortable truth is that most high-cardinality attributes are added with good intentions but rarely queried. They accumulate over time as developers instrument “just in case,” creating a technical debt that manifests as runaway costs and degraded performance.
The key principles:
- Centralize governance – Use the OTel Collector as your enforcement point
- Question uniqueness – High-cardinality data belongs in traces/logs, not metrics
- Standardize naming – Semantic conventions prevent cardinality multiplication
- Measure and iterate – Regular cardinality audits should be part of your operational cadence
By applying these strategies, you’re not sacrificing observability—you’re refining it. You’re separating the signal from the noise, ensuring that when your SREs need answers at 3 AM during an incident, your dashboards load in seconds rather than timing out.
The journey from cardinality chaos to optimized observability doesn’t happen overnight, but the results speak for themselves. SparkPlug Motors reduced their metric streams by 99.94%, cut costs by 76%, and dramatically improved their ability to actually use their observability data when it mattered most.
As platform architects and engineering leaders, our job isn’t to collect all possible data. It’s to collect the right data, in the right place, at the right granularity. Master cardinality, and you master observability economics.
Frequently Asked Questions
Should I ever use high-cardinality attributes in metrics?
Only if you have a specific business justification and the budget to support it. For most use cases, high-cardinality data belongs in traces or logs where you can sample and index selectively.
How do I know if cardinality is my problem?
Look for signs like: Prometheus memory consumption growing faster than traffic, slow dashboard queries, increased observability vendor costs, or time-series databases running out of memory. Run count by (__name__) ({__name__=~".+"}) in Prometheus to see your top cardinality offenders.
Won't dropping attributes lose important debugging context?
No, if you route high-cardinality data to the right pillar. Use metrics for trends and alerting, traces for request-level debugging, and logs for detailed context. The OpenTelemetry Collector can send the same data to different destinations based on use case.
Can I apply these techniques to an existing deployment?
Yes. The OpenTelemetry Collector sits between your applications and backends, so you can deploy it incrementally without modifying application code. Start with one service as a pilot, validate the results, then roll out across your environment.
What's the biggest mistake teams make with cardinality?
Adding unique IDs (order IDs, user IDs, request IDs, container IDs) as metric attributes without understanding the downstream cost. Always ask: “Will I query by this attribute?” If not, it shouldn't be in your metrics.
Ready to Optimize Your Observability Pipeline?
If you’re facing cardinality challenges in your OpenTelemetry implementation—or you’re planning a large-scale observability rollout and want to avoid these pitfalls from the start—we can help.
At Integration Plumbers, we specialize in designing and implementing enterprise-grade observability solutions that balance visibility with cost efficiency. Whether you need help configuring OTel Collectors, establishing governance frameworks, or building custom integrations, our team has the deep technical expertise to get it right.
Schedule a consultation with our team →
Let’s discuss your specific observability challenges and design a solution that delivers better insights without the sticker shock.