Recently, my team was tasked with making an update to a Prometheus deployment that had been set up only a few weeks earlier. At first glance, everything looked fine. Prometheus was running, scraping targets, and feeding metrics into Grafana without any obvious errors. From the outside, it appeared to be a healthy and straightforward installation.
Problems only surfaced once an attempt was made to extend the system. At that point, it was noticed that behavior stopped lining up with current documentation, configuration files did not live where we expected them to, and services behaved in ways that were difficult to explain. The root cause turned out to be deceptively simple: Prometheus had been installed using Snap and was running a very old release. Despite being a recent deployment, the Snap package itself lagged far behind upstream, creating a gap between how Prometheus was expected to work and how it actually behaved.
This blog walks through the pitfalls we encountered with a Snap-based Prometheus installation and then outlines how to set up a full Prometheus server using upstream static binaries, with explicit configuration, predictable service management, and behavior that matches modern documentation.
Key Terms (Click to expand)
Prometheus: An open-source monitoring system and time-series database that scrapes metrics over HTTP.
Snap: A Linux packaging system that installs applications in isolated environments managed by snapd.
Exporter: A service that exposes metrics in Prometheus format, usually on a dedicated TCP port.
systemd: The Linux init system used to manage long-running services.
Static Binary Install: Installing Prometheus directly from official releases rather than a package manager.
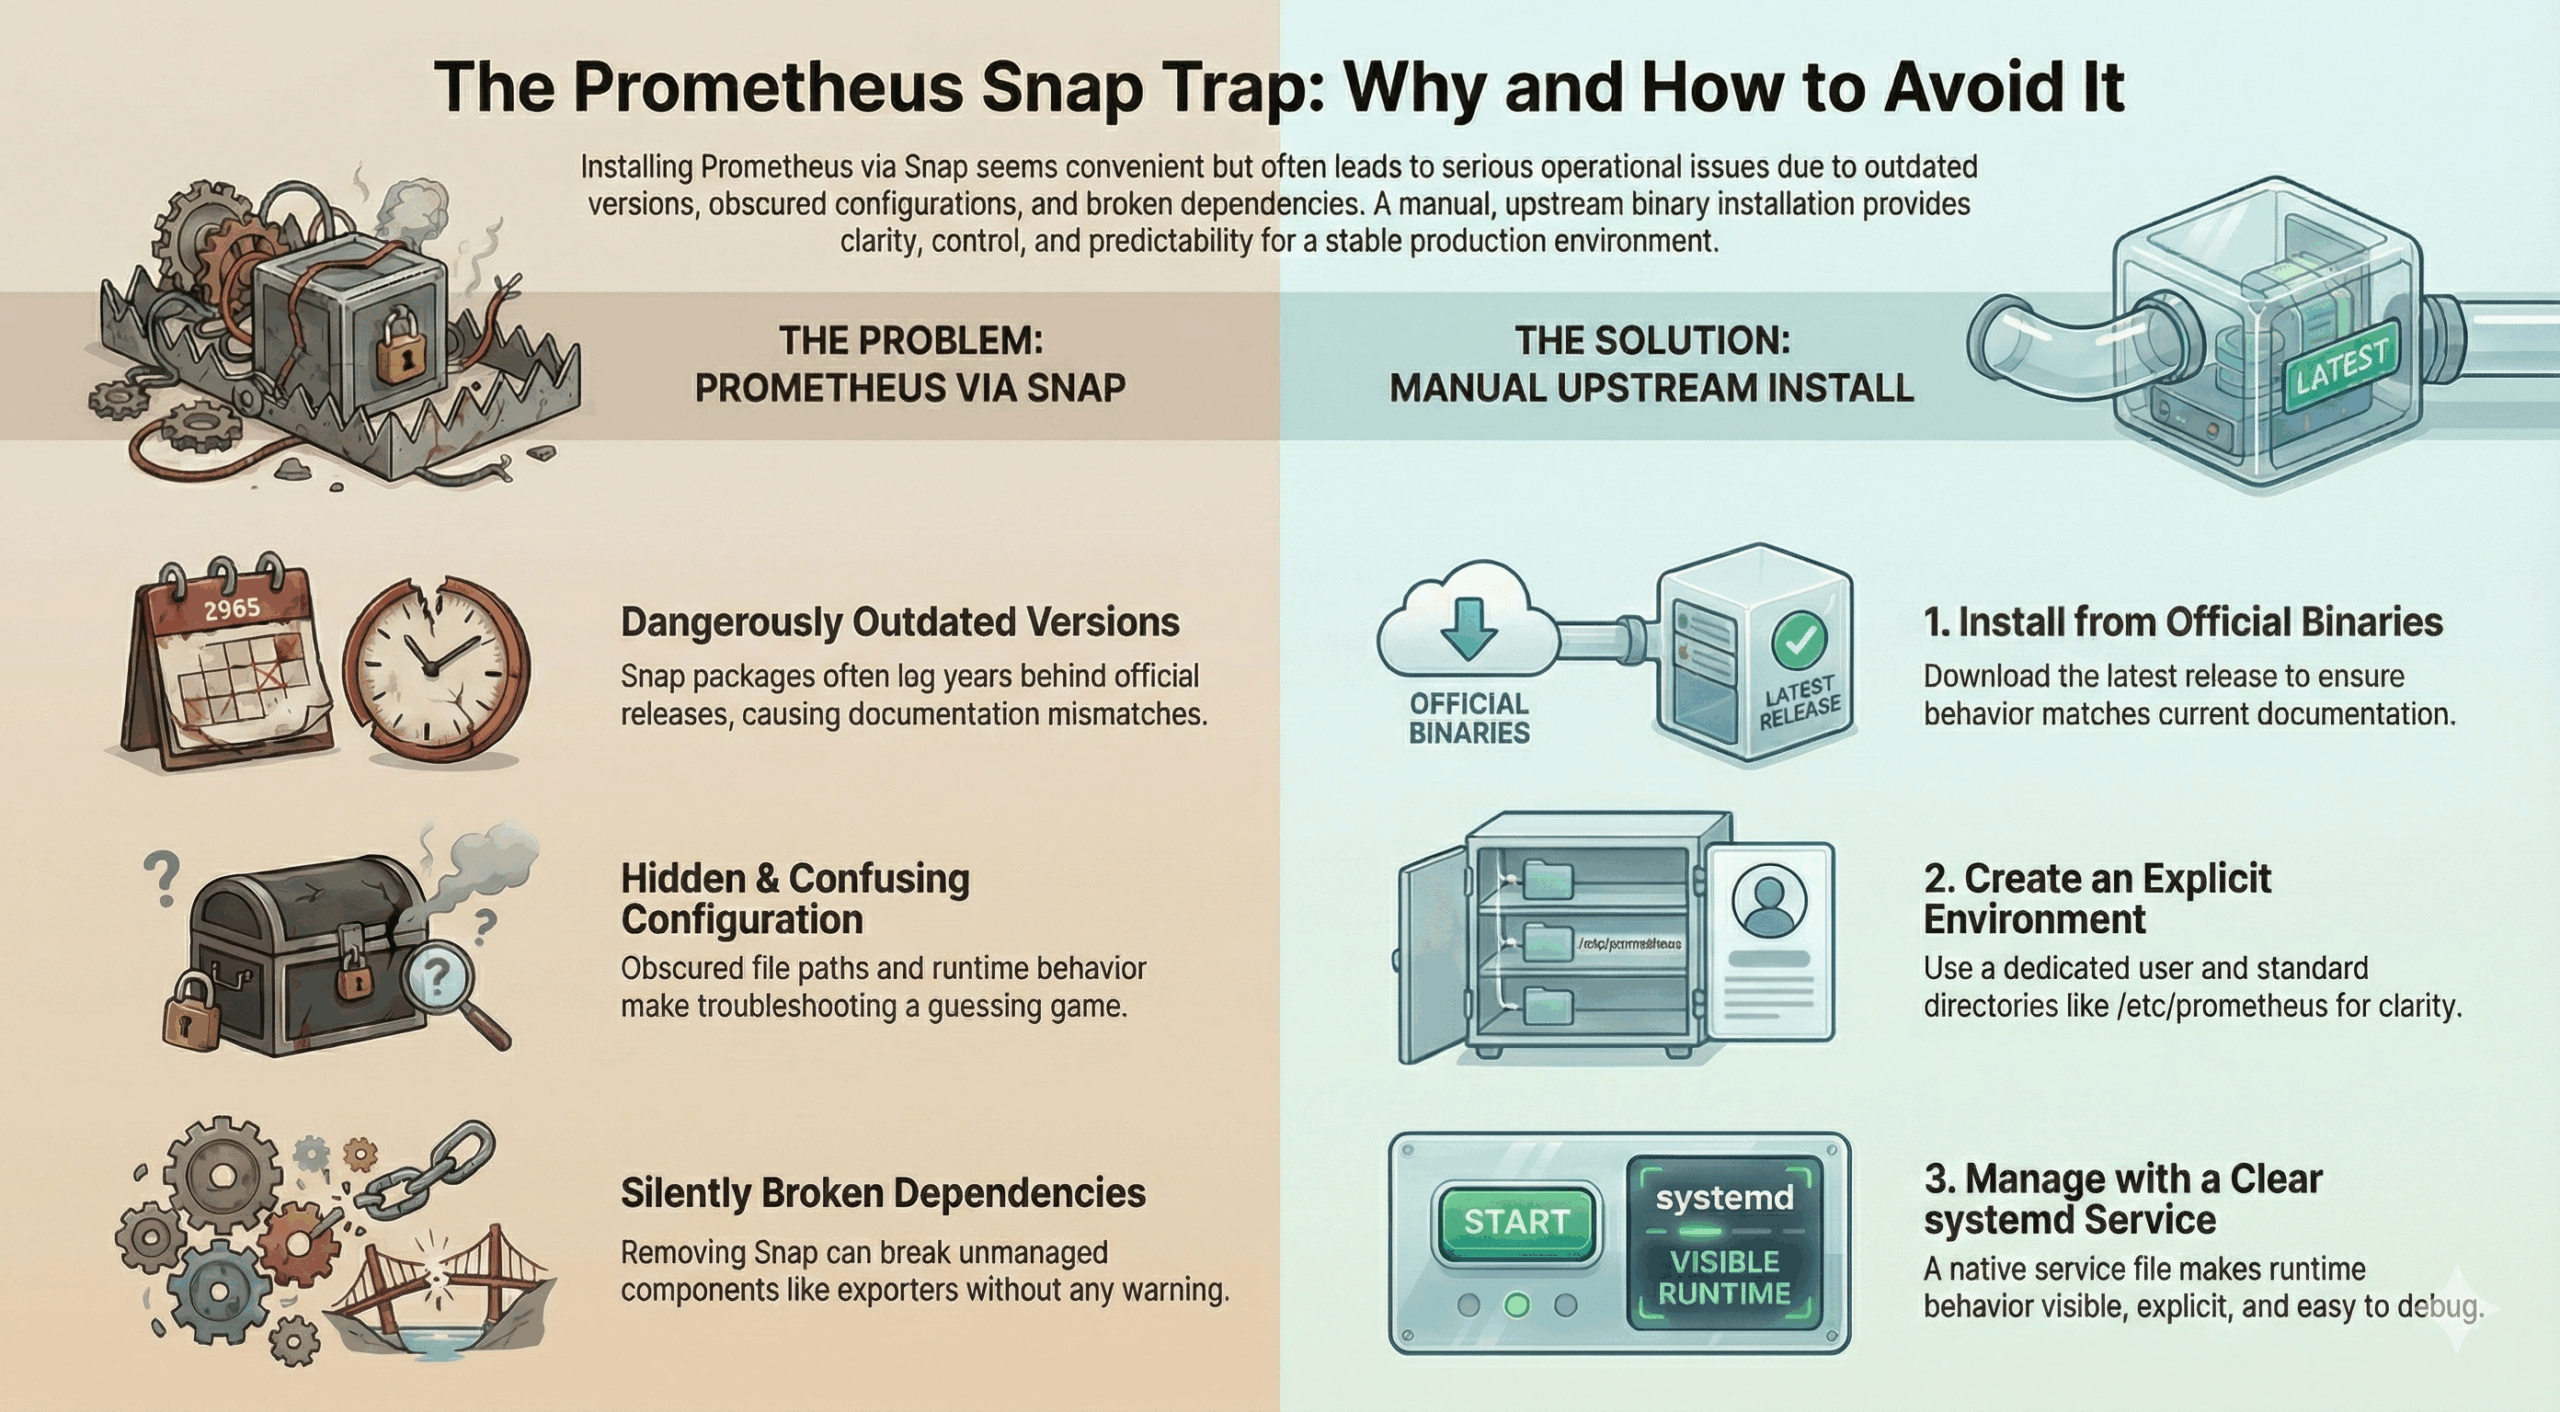
Why Prometheus via Snap Becomes a Problem
Snap makes it extremely easy to get Prometheus running quickly. That convenience is exactly why it often becomes a long-term problem.
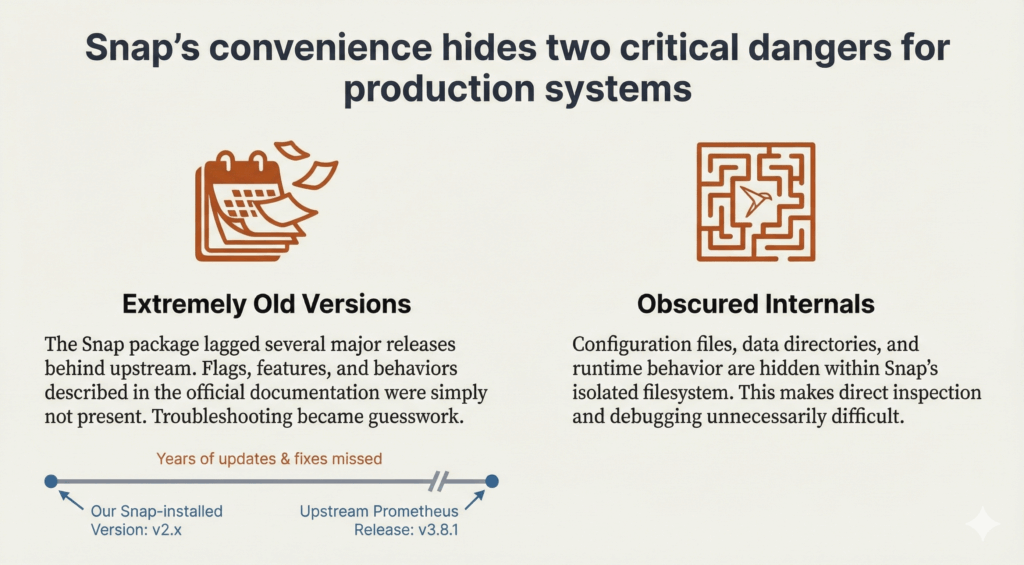
Extremely Old Versions
The Snap version in use was so old that much of the official Prometheus documentation was no longer relevant. Flags, features, and behaviors had changed upstream, but the running system never reflected those improvements. Troubleshooting became guesswork because the system did not behave like modern Prometheus.
Setting Up Prometheus the Right Way
Once Snap was removed, rebuilding Prometheus in a clean, explicit way became straightforward.
Installing Prometheus from Upstream
We downloaded the latest Prometheus release directly from the Prometheus project and installed the binaries manually. This ensured we were running a current version with documentation that actually matched behavior, rather than a Snap-packaged build that lagged several major releases behind upstream.
On the Prometheus host, we downloaded and extracted the release archive:
cd /tmp wget https://github.com/prometheus/prometheus/releases/download/v3.8.1/prometheus-3.8.1.linux-amd64.tar.gz tar -xvf prometheus-3.8.1.linux-amd64.tar.gz cd prometheus-3.8.1.linux-amd64We then installed the Prometheus binaries into a standard location on the system path:
sudo cp prometheus promtool /usr/local/bin/ sudo chown prometheus:prometheus /usr/local/bin/prometheus /usr/local/bin/promtoolPlacing the prometheus and promtool binaries in /usr/local/bin keeps them separate from distribution-managed packages and makes the installation explicit, predictable, and easy to upgrade in the future. At this point, running prometheus –version and promtool –version confirmed that we were using the expected upstream release.
Creating a Dedicated Prometheus User
Prometheus should not run as root. A dedicated prometheus user was created with no login shell. Configuration and data directories were created and owned by this user to keep permissions clear and predictable.
Common locations included:
- /etc/prometheus for configuration
- /var/lib/prometheus for time-series data
Migrating and Validating Configuration
The existing prometheus.yml was copied out of the Snap directory and placed under /etc/prometheus. Before starting Prometheus, we validated the configuration using:
promtool check config /etc/prometheus/prometheus.ymlThis step caught errors early and ensured Prometheus would start cleanly.
Managing Prometheus with systemd
A native systemd service was created to start Prometheus directly with explicit flags for:
- Config file location
- Data directory
- User and group
This made the runtime behavior fully visible and easy to debug.
Lessons Learned from Exporters
One unexpected issue surfaced after migration: an exporter that had previously worked stopped responding. Prometheus was correctly configured to scrape localhost:9348, but nothing was listening on that port anymore.
The exporter itself had never been properly documented or managed as its own service. It was not part of Prometheus, and it was not automatically started once Snap was removed. This reinforced an important principle: exporters should always be installed and managed as independent services, never implicitly tied to a Prometheus package.
Key Takeaways
- Snap-based Prometheus installs often run versions that are years out of date.
- Configuration and runtime behavior are obscured by Snap’s filesystem layout.
- Removing Snap can silently break exporters that were never explicitly managed.
- Installing Prometheus from upstream binaries provides clarity and control.
- Explicit systemd services make Prometheus easier to operate long-term.
Frequently Asked Questions
Is Snap ever appropriate for Prometheus?
Snap can be fine for short-lived test systems, but it is risky for long-running production monitoring.
Why not just upgrade the Snap version?
In practice, Snap-managed Prometheus often lags behind upstream releases, and the hidden paths and wrappers still complicate troubleshooting.
What is the biggest takeaway from this migration?
Monitoring infrastructure should be boring and predictable. If understanding how Prometheus starts and where it reads config takes detective work, something is wrong.