Introduction: When “Magic” Isn’t Enough
OpenTelemetry’s auto-instrumentation is genuinely impressive. Drop a few environment variables into your Django or Flask deployment, restart the service, and suddenly you’re capturing request latencies, database call durations, and error rates without touching application code. Observability “magic” at its finest.
But that magic has boundaries.
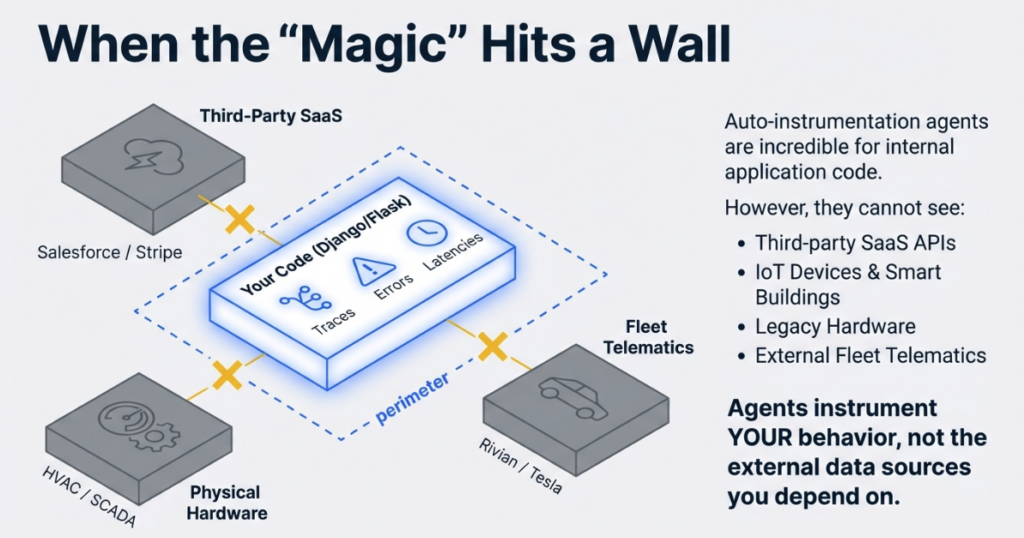
What happens when you need visibility into systems that don’t have HTTP handlers or database connections? What about the third-party SaaS API that controls your building’s HVAC system? The legacy industrial controller running your manufacturing line? The vehicle telematics API that tracks your fleet’s battery health and tire pressure?
Auto-instrumentation agents can’t follow API calls you’re making—they’re designed to instrument your application’s behavior, not the external data sources you depend on. This is where custom OpenTelemetry collectors become essential.
In this guide, we’ll build a production-grade OTEL collector in Python that pulls data from the Rivian vehicle API—a real-world example of extending observability beyond your application perimeter. The patterns you’ll learn apply equally to weather APIs, smart building systems, legacy SCADA hardware, or any data source where you need programmatic access to metrics.
Target Audience: This post assumes you understand basic OpenTelemetry concepts (metrics vs. traces, the concept of exporters) and have written Python. You don’t need to be an OTEL expert, but familiarity with observability fundamentals will help.
Key Terms (Click to expand)
OTLP (OpenTelemetry Protocol): The standardized protocol for transmitting telemetry data between collectors and backends, supporting metrics, traces, and logs over gRPC or HTTP.
Metric Instrument: OpenTelemetry SDK objects that record measurements—Gauges for fluctuating values (temperature, battery level), Counters for cumulative totals (requests served), and Histograms for distributions.
MeterProvider: The factory pattern component in the OTEL SDK that creates and manages metric instruments, analogous to TracerProvider for distributed tracing.
Periodic Exporting: A batching strategy where the collector aggregates metrics in memory and flushes them to the backend at regular intervals, reducing network overhead and respecting API rate limits.
Resource Attributes: Metadata attached to all telemetry from a source (service.name, host.name, deployment.environment) that enables filtering and correlation across distributed systems.
Before diving into code, let’s map the data flow:
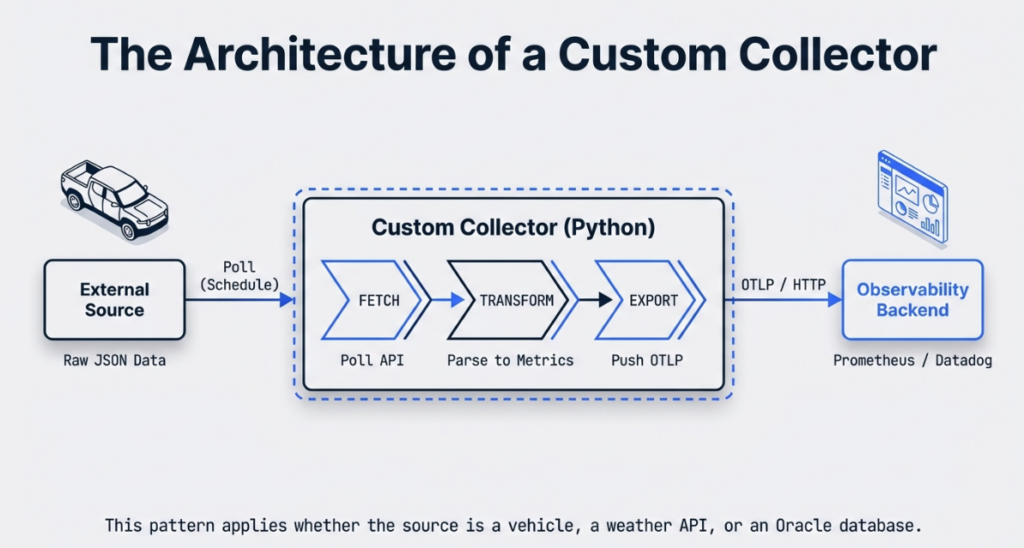
The collector sits between your data source and your observability backend, performing three critical functions:
- Fetch: Poll the external API on a defined schedule (respecting rate limits)
- Transform: Parse the vendor-specific JSON/XML/CSV into standardized OTEL metrics
- Export: Push formatted telemetry to your OTLP-compatible backend
Key Python SDK Components
Your collector relies on three core OpenTelemetry SDK classes:
MeterProvider: The factory that creates metric instruments. Think of it as the central registry for all measurements your collector will produce. You configure it once with resource attributes (service name, environment) and exporters.
PeriodicExportingMetricReader: Controls the batching and transmission schedule. This is critical—you don’t send individual metric updates over the network; instead, you aggregate them in memory and flush every N seconds. This component manages that interval.
OTLPMetricExporter: Packages your metrics into OTLP format (Protocol Buffers or JSON) and transmits them to your backend via HTTP or gRPC. It handles serialization, compression, and retry logic.
The relationship: MeterProvider uses PeriodicExportingMetricReader, which uses OTLPMetricExporter. Data flows through this pipeline: instrument → reader → exporter → backend.
Setting Up the Development Environment
Modern Python development benefits from tools that eliminate dependency hell. We’ll use uv—a Rust-based package manager that’s significantly faster than pip and handles virtual environments cleanly.
Installing uv
curl -LsSf https://astral.sh/uv/install.sh | shProject Initialization
# Create project directory
mkdir ip-rivian-otel && cd ip-rivian-otel

# Install and pin Python 3.14
uv python install 3.14
uv python pin 3.14

# Create virtual environment
uv venv --python 3.14

# Activate it
source .venv/bin/activate  # Linux/Mac
# .venv\Scripts\activate   # Windows
Required Dependencies
Create requirements.txt:
opentelemetry-sdk
opentelemetry-exporter-otlp
opentelemetry-exporter-otlp-proto-http
Install dependencies:
uv pip install -r requirements.txtWhy Python for Collectors?
Python is the “glue language” of infrastructure engineering:
- Ubiquity: Pre-installed on virtually every Linux distribution
- Library Ecosystem: Thousands of API client libraries (AWS SDK, Google Cloud, vendor-specific APIs)
- Readability: Teams can maintain collectors without deep language expertise
- Rapid Iteration: Prototype a collector in an afternoon, refine it over weeks
For enterprise environments juggling Oracle integrations, cloud APIs, and legacy protocols, Python lets you move fast without sacrificing maintainability.
Step-by-Step Implementation
Step 1: Handling Git Submodules for API Libraries
Many third-party API clients exist as separate repositories. In our Rivian example, we’re using a community-maintained Python client as a git submodule. This pattern is common in enterprise integrations.
Add the submodule:
git submodule add https://github.com/the-mace/rivian-python-api.git ip_rivian_otel/rivian-python-apiUpdate .gitmodules:
[submodule "rivian-python-api"]
    path = ip_rivian_otel/rivian-python-api
    url = https://github.com/the-mace/rivian-python-api.git
When cloning, use:
git clone --recurse-submodules <your-repo-url>Why Submodules? They pin a specific version of the upstream library, preventing breaking changes from affecting your collector. The tradeoff is added complexity—team members must remember --recurse-submodules when cloning.
Step 2: Configuring the MeterProvider
Create ip_rivian_otel/__main__.py:
import os
from opentelemetry import metrics
from opentelemetry.sdk.metrics import MeterProvider
from opentelemetry.sdk.metrics.export import PeriodicExportingMetricReader
from opentelemetry.sdk.resources import SERVICE_NAME, Resource
from opentelemetry.exporter.otlp.proto.http.metric_exporter import OTLPMetricExporter

class IPRivianOTLP:
    def __init__(self, endpoint="http://localhost:4317"):
        # Define resource attributes for filtering in backend
        self.resource = Resource.create(
            attributes={
                SERVICE_NAME: "ip-rivian-otel",
                "deployment.environment": os.getenv("ENV", "dev"),
                "vehicle.owner": os.getenv("VEHICLE_OWNER", "fleet")
            }
        )

        # Configure OTLP exporter
        self.metric_exporter = OTLPMetricExporter(endpoint)

        # Set export interval (5 seconds for dev, 60+ for prod)
        self.reader = PeriodicExportingMetricReader(
            self.metric_exporter,
            export_interval_millis=5000
        )

        # Create provider
        self.meter_provider = MeterProvider(
            resource=self.resource,
            metric_readers=[self.reader]
        )

        # Set as global provider
        metrics.set_meter_provider(self.meter_provider)
Key Design Decisions:
- Resource Attributes:
SERVICE_NAMEis mandatory for OTLP. Additional attributes likedeployment.environmentlet you filter production vs. staging metrics in Grafana. - Export Interval: 5 seconds is aggressive for development (faster feedback). Production should use 60+ seconds to reduce network traffic and respect API rate limits.
- HTTP vs. gRPC: We’re using
OTLPMetricExporterwith HTTP (proto.http). gRPC is more efficient but has steeper operational complexity. HTTP works with standard load balancers and proxies.
Step 3: Defining Metric Instruments
OpenTelemetry supports several instrument types. Choose based on the data’s behavior:
- Gauge: Values that go up and down (battery level, tire pressure, temperature)
- Counter: Monotonically increasing values (total miles driven, charge cycles)
- Histogram: Distribution of values (charge session durations, energy consumption per trip)
For vehicle telemetry, we’ll use Gauges:
def configure_instruments(self):
meter = metrics.get_meter("rivian-telemetry")
# Battery metrics
self.battery_level = meter.create_gauge(
"vehicle.battery.level",
description="Battery charge in kWh",
unit="kWh"
)
self.battery_percentage = meter.create_gauge(
"vehicle.battery.percentage",
description="Battery state of charge",
unit="%"
)
# Tire pressure status (binary: 0=low, 1=ok)
self.tire_lf_status = meter.create_gauge(
"vehicle.tire.pressure.front_left",
description="Front left tire pressure status",
unit="1"
)
self.tire_rf_status = meter.create_gauge(
"vehicle.tire.pressure.front_right",
description="Front right tire pressure status",
unit="1"
)
# Charging state
self.charger_connected = meter.create_gauge(
"vehicle.charger.connected",
description="Charger connection status",
unit="1"
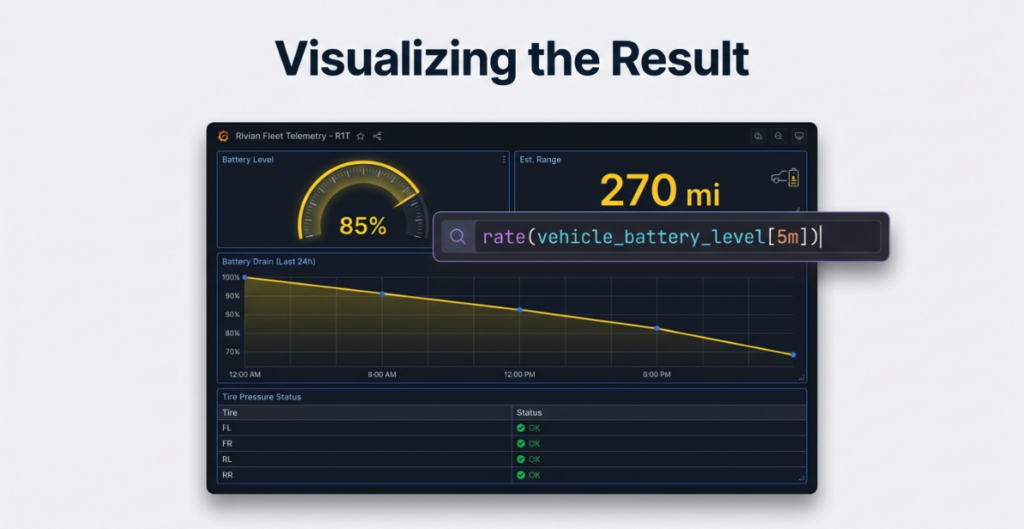
)Naming Conventions: Follow semantic conventions where possible. For custom metrics, use a hierarchy: domain.component.attribute (e.g., vehicle.battery.level). This makes Prometheus queries intuitive:
rate(vehicle_battery_level[5m]) # Battery drain rateStep 4: The Collection Loop
This is the heart of your collector—fetch data, parse it, update instruments:
import time
import logging

logging.basicConfig(level=logging.INFO)
logger = logging.getLogger(__name__)

def collect(self, sleep_interval=90):
    """
    Main collection loop with error handling
    """
    try:
        while True:
            try:
                # Fetch vehicle data from API
                vehicles = self.rivian_get_vehicles()

                if not vehicles:
                    logger.warning("No vehicles found, skipping cycle")
                    time.sleep(sleep_interval)
                    continue

                # Process first vehicle (extend for fleet management)
                v = vehicles[0]

                # Parse tire pressure (API returns "OK" or "LOW")
                tire_lf = 1 if v['state']['tirePressureStatusFrontLeft']['value'] == "OK" else 0
                tire_rf = 1 if v['state']['tirePressureStatusFrontRight']['value'] == "OK" else 0

                # Parse battery data
                batt_level = v['state']['batteryLevel']['value']
                batt_capacity = v['state']['batteryCapacity']['value']
                batt_percentage = round((batt_level / batt_capacity) * 100)

                # Parse charger status
                charger_status = 0 if v['state']['chargerStatus']['value'] == 'chrgr_sts_not_connected' else 1

                # Update OTEL instruments
                self.tire_lf_status.set(tire_lf)
                self.tire_rf_status.set(tire_rf)
                self.battery_level.set(batt_level)
                self.battery_percentage.set(batt_percentage)
                self.charger_connected.set(charger_status)

                logger.info(f"Updated metrics: Battery {batt_percentage}%, "
                    f"Charger {'Connected' if charger_status else 'Disconnected'}")

            except KeyError as e:
                logger.error(f"API response missing expected field: {e}")
            except Exception as e:
                logger.error(f"Collection cycle failed: {e}", exc_info=True)

            time.sleep(sleep_interval)

    except KeyboardInterrupt:
        logger.info("Shutting down collector...")
    finally:
        self.meter_provider.shutdown()
Critical Pattern: The inner try/except catches transient errors (API timeouts, malformed responses) without killing the collector. The outer try/finally ensures graceful shutdown—the meter_provider.shutdown() call flushes any pending metrics before exit.
Step 5: Fetching Data from the External API
Your API interaction layer should handle authentication and parsing:
def rivian_get_vehicles(self):
    """
    Fetch vehicle inventory with error handling
    """
    try:
        # Authenticate (tokens managed via environment variables)
        owner = self.rivian_client.get_user_information()

        vehicles = []
        for v in owner['data']['currentUser']['vehicles']:
            vehicles.append({
                'id': v['id'],
                'vin': v['vin'],
                'model': v['vehicle']['model'],
                'state': self.rivian_get_vehicle_state(v['id'])
            })
        return vehicles

    except requests.exceptions.RequestException as e:
        logger.error(f"API request failed: {e}")
        return []
    except KeyError as e:
        logger.error(f"Unexpected API response structure: {e}")
        return []
Generic Pattern for Any API:
- Authenticate: Use OAuth tokens, API keys, or session cookies (stored in environment variables)
- Parse Response: Extract nested JSON fields with defensive
get()calls - Return Normalized Data: Your collection loop shouldn’t care about vendor-specific JSON structures
This abstraction makes it easy to swap Rivian for Weatherstack, Nest Thermostats, or Oracle Cloud APIs—the collection loop remains unchanged.
Key Takeaways
- Auto-instrumentation covers standard web frameworks, but custom collectors unlock telemetry from APIs, IoT devices, and legacy systems that agents can’t reach
- The OpenTelemetry Python SDK gives you granular control over collection intervals, metric types, and export destinations through MeterProvider and PeriodicExportingMetricReader
- A well-structured collector separates concerns into three layers: API interaction, data transformation, and OTEL instrument updates—making it easy to swap data sources without rewriting core logic
- Error handling at both the collection-cycle and process levels is essential: transient API failures should never crash a long-running collector
- The patterns in this guide apply to any external data source—vehicle APIs, smart building systems, cloud provider metrics, or legacy industrial protocols
Conclusion: You Have a Working Collector—Now What?
At this point, you have a fully functional custom OpenTelemetry collector. It authenticates against an external API, fetches vendor-specific data on a schedule, transforms that data into standardized OTEL metrics, and exports them to any OTLP-compatible backend. That’s a significant capability—you’ve extended your observability perimeter beyond what auto-instrumentation can reach.
The five-step pattern we’ve walked through is deliberately portable. The Rivian vehicle API is our example, but the architecture is identical whether you’re pulling metrics from a weather service, a smart building controller, an Oracle Cloud API, or an industrial SCADA system. Configure a MeterProvider, define your instruments, build a resilient collection loop, and abstract your API interaction layer. The data source changes; the scaffolding doesn’t.
But getting metrics flowing is only the first milestone. Production deployments introduce a new set of challenges that deserve dedicated treatment:
- Rate limiting and backoff strategies — how to respect API quotas, implement exponential backoff, and avoid getting your collector throttled or banned
- Cardinality management — why unbounded labels can silently explode your Prometheus storage costs, and how to design metric dimensions that scale
- Deployment and self-monitoring — running collectors as systemd services or Docker containers, and instrumenting the collector itself so you know when it’s unhealthy
- Visualization and alerting — wiring your metrics to Prometheus and Grafana dashboards that surface actionable insights
We’ll cover these production-hardening topics in upcoming posts in this series. For now, the best next step is to get your hands dirty: identify one “dark” area in your infrastructure—a system that’s critical but invisible to your current observability stack—and build a 100-line collector for it this week. You’ll surface insights that have been hiding in plain sight.
Reference Implementation
The complete code from this guide is available at:
https://github.com/IntegrationPlumbers/ip-rivian-otel-public
Clone it, adapt it, and make it yours. The patterns are universal—only the API endpoint changes.
Frequently Asked Questions
Can I use this pattern with APIs that use webhooks instead of polling?
Yes. Replace the while True loop with a web server (Flask, FastAPI) that listens for webhook callbacks. When the webhook fires, update your OTEL instruments. The MeterProvider and instrument definitions remain identical—only the trigger mechanism changes.
What’s the difference between using OTLP and a native Prometheus exporter?
OTLP is vendor-neutral—your collector can send to Prometheus, Grafana Cloud, Datadog, or New Relic without code changes (just swap the endpoint). Native Prometheus exporters lock you into a single backend. Use OTLP unless you need Prometheus-specific features like custom timestamp handling.
How do I test my collector without hitting the production API?
Mock the API client in unit tests using Python’s unittest.mock. For integration tests, use a staging API endpoint or VCR.py to record and replay HTTP interactions. The abstraction in Step 5—isolating API calls into their own method—makes this straightforward.
Can I collect traces in addition to metrics?
Absolutely. Add a TracerProvider alongside your MeterProvider using the same resource attributes. Wrap your API calls in spans (tracer.start_as_current_span()) to capture call durations and error details as distributed traces. Both providers share the same OTLP exporter pipeline.
Does this approach work for APIs that return data for multiple entities (e.g., a fleet of 100 vehicles)?
Yes, but be mindful of cardinality. For small fleets, you can use metric labels to differentiate vehicles. For large fleets (thousands of entities), you’ll want to explore strategies like splitting into multiple collector instances or using resource attributes for high-cardinality identifiers. We’ll cover cardinality management in detail in the next post in this series.
Ready to Build Enterprise-Grade Observability Solutions?
If you’re facing gaps in your telemetry stack—APIs that aren’t instrumented, legacy systems without agents, or custom integrations that need visibility—we can help.
At Integration Plumbers, we specialize in designing and implementing observability solutions for complex enterprise environments. Whether you need custom OpenTelemetry collectors, integrations with Oracle ecosystems, large-scale OTEL deployments, or governance frameworks to prevent cardinality explosions, our team has the deep technical expertise to get it right.
We’ve built collectors for everything from vehicle fleets to industrial IoT, from Oracle Cloud Infrastructure monitoring to SCADA system integrations. If it has an API (or even if it doesn’t), we can make it observable.
Schedule a consultation with our team →
Let’s discuss your specific observability challenges and design a solution that delivers comprehensive visibility without the operational complexity.